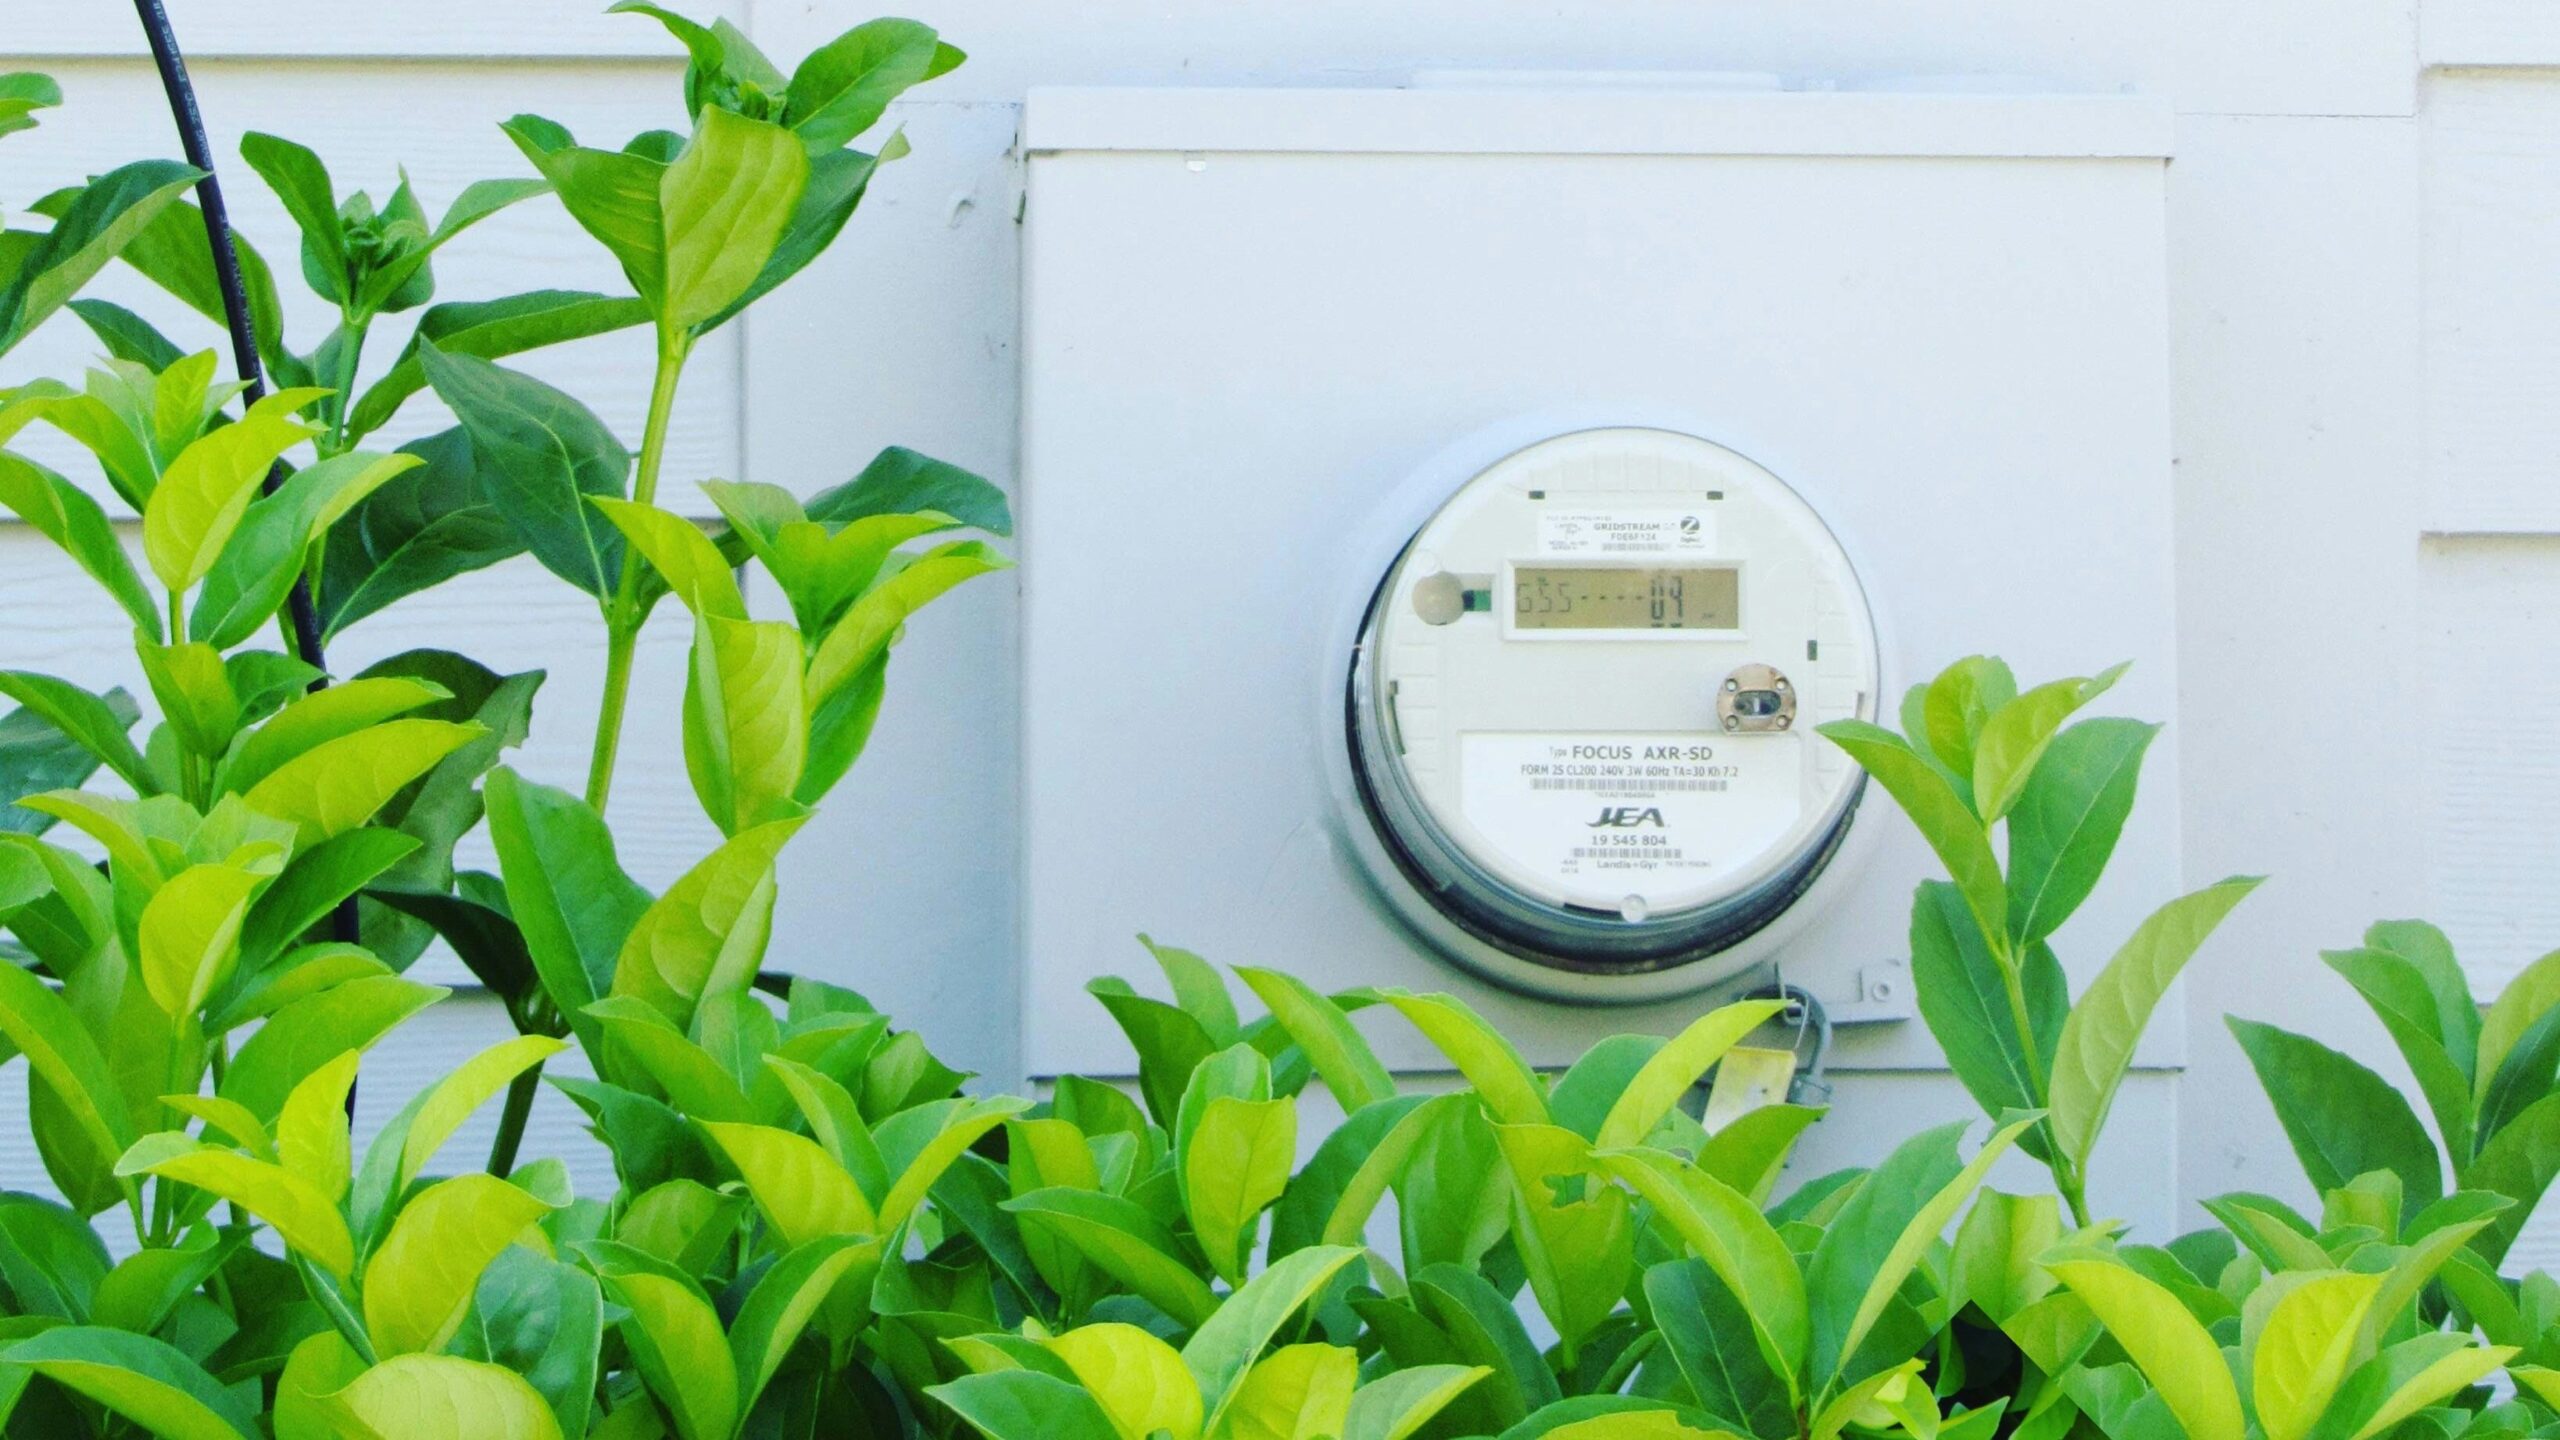
Electric bills have become a bigger line item for lower-income households than they were even a few years ago, and a new federal research update puts a specific number on how big. Lawrence Berkeley National Laboratory, working with the consulting firm Brattle Group, released a July 2026 update to its long-running study of retail electricity prices, and it found that roughly a third of households earning under $50,000 a year now spend at least 5 percent of their income just to keep the lights and appliances running. The lab’s researchers frame that as part of a longer pattern: residential electric rates have climbed faster than the rest of the economy for years, and the households least able to absorb it are the ones carrying the heaviest share.
What Berkeley Lab’s July Update Found
The update, produced for the U.S. Department of Energy, tracks national and state-level retail electricity prices through 2025 and adds a fresh look at affordability. Its headline finding on cost burden: about one in three households earning less than $50,000 annually now pays 5 percent or more of income toward electricity alone, a threshold researchers use to flag meaningful financial strain. The lab also found that this burden has been climbing, not holding steady, in 27 states and the District of Columbia over the past seven years, with the sharpest increases in D.C., Pennsylvania, California and Maryland.
Behind that burden is a rate trend the report lays out in plain terms: nominal residential electricity rates are up 33 percent since 2019, compared with 26 percent for commercial customers and 27 percent for industrial customers. Residential customers, in other words, have absorbed the fastest rate growth of any customer class over that stretch, even before accounting for what that growth means for a household living closer to the margin.
Free retirement updates: One number can cost or save hundreds a month in retirement. The free Retirement Shield newsletter surfaces the ones worth knowing. Sign up free.
Why State Regulators Keep Approving More Increases
One reason the report expects the pressure to continue rather than ease: state utility regulators aren’t turning down most of what utilities ask for. Berkeley Lab found that from 2021 through 2025, regulators approved 64 percent of the dollar value of the rate increase requests utilities filed. That’s not 64 percent of the number of cases, which can undercount how much money is actually at stake, it’s 64 percent of the dollars utilities sought, which means the majority of requested revenue increases are making it through the approval process largely intact. Utilities file these cases to recover rising costs, including grid maintenance, storm hardening, and new infrastructure, and regulators weigh those requests against what customers can bear, but the approval rate the lab documented suggests that balance has been tilting toward recovering utility costs rather than holding rates down.
The report frames this as one of the clearest drivers behind the affordability numbers: when the large majority of requested revenue makes it through state review, the increases show up on the next bill cycle almost regardless of what a household earns. Since residential customers have already absorbed faster rate growth than commercial or industrial customers since 2019, a high approval rate on new requests means that gap has more room to widen rather than narrow in the near term, according to the lab’s own analysis.
Which States Are Carrying the Heaviest Load
The four states and district Berkeley Lab singled out for the steepest seven-year increases in bill burden, the District of Columbia, Pennsylvania, California and Maryland, span very different electricity markets and climates, which suggests no single regional factor explains the pattern on its own. What they share is a documented trend: households in these places are spending a larger share of income on electricity today than they were seven years ago, and the gap between them and states with a lighter burden appears to be widening rather than closing. The lab’s state-by-state breakdown is intended to help policymakers target relief efforts, such as expanded bill-assistance programs, at the places where the burden has grown fastest rather than applying a uniform national response. Twenty-seven states plus the District of Columbia showing a rising burden also means the reverse is true elsewhere: a majority of states have kept the trend flatter, which is part of why Berkeley Lab’s researchers emphasize state-level detail over a single national number when advising policymakers on where assistance dollars go furthest.
What 5 Percent of Income Actually Looks Like
The math behind the headline number is straightforward. For a household earning $40,000 a year, 5 percent works out to about $2,000 annually, or roughly $167 a month, spent on electricity before any other utility bill is counted. The U.S. Department of Energy’s own affordability tools track this same concept, generally described as “energy burden,” as the share of gross household income that goes toward home energy costs, and the department uses it to identify which communities most need efficiency upgrades or bill assistance. A household spending at that level on electricity alone, before gas, water, or other utilities, has meaningfully less room in its monthly budget for everything else, and Berkeley Lab’s finding that this now applies to roughly a third of households under $50,000 a year puts a scale on a burden that’s often discussed only in the abstract.
Berkeley Lab’s full data set, including the state-by-state figures behind the 27-state finding, is available through its public research page, which the lab says it will keep updating as new rate and cost data become available.
This article was produced with AI assistance and reviewed by a human editor. Figures are linked to their primary sources; where a claim could not be verified from the public record, we say so.
More Financial Reading