The federal government has finished tallying how much of last year’s food-assistance spending went out in the wrong amount, and the number is stark: more than one in every ten dollars. Beginning as soon as October 2027, the states with the worst records will start covering part of that cost themselves, a shift that could ripple into state budgets and the taxpayers who fund them. For households that rely on the Supplemental Nutrition Assistance Program, or whose state government is about to absorb a new bill, the numbers behind that shift are now public record.
USDA’s Quality Control Numbers for Fiscal Year 2025
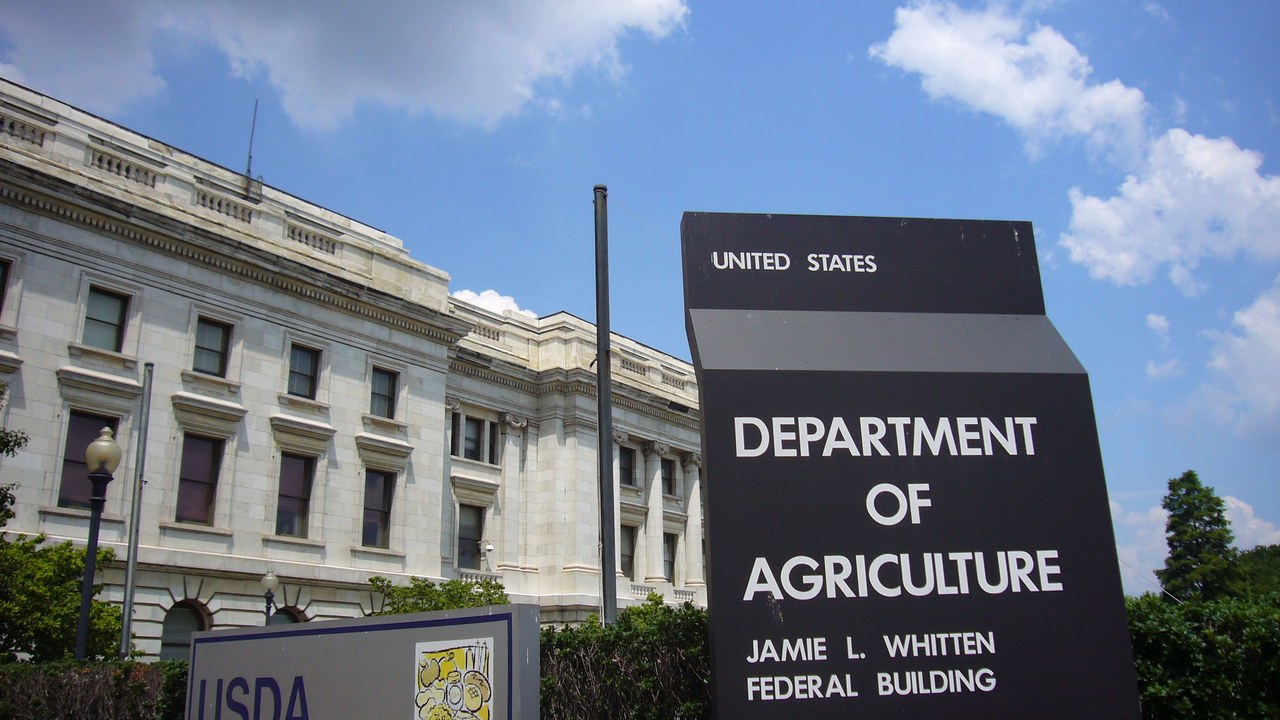
The U.S. Department of Agriculture’s Food and Nutrition Administration announced on June 24, 2026 that the national SNAP payment error rate for fiscal year 2025 came in at 10.62 percent, well above the 6 percent threshold Congress set for the program. Combined, overpayments and underpayments across the country added up to what the agency called “a collective $10.1 billion in improper payments nationwide.” The agency describes the FY2025 figure as a modest improvement over fiscal year 2024, though it says the underlying waste remains significant enough to justify the new financial consequences described below. Agriculture Secretary Brooke L. Rollins called the results “further proof that state accountability is severely lacking in SNAP,” and said she hopes states “prioritize needy families and the American taxpayer over politics.” Most of the error nationally runs in one direction: an agency state-by-state accounting puts the national split at 9.28 percent in overpayments against 1.33 percent in underpayments, meaning the bulk of the miscalculated dollars went out as too much benefit rather than too little.
Free retirement updates: Enrollment and claim windows come and go, and missing one can cost you real money. The free Retirement Shield newsletter keeps you ahead of the deadlines that matter. Sign up free.
The H.R. 1 Cost-Share Rule States Now Face
Under H.R. 1, states with a payment error rate at or above 6 percent must start covering 5, 10, or 15 percent of their own SNAP benefit costs, with the exact tier rising alongside the error rate, and that requirement takes effect “in most cases, as soon as Oct. 1, 2027.” Fiscal year 2025 is the first year of data the agency can use to calculate which states land in which tier. The announcement does not spell out which specific error-rate bands map to the 5, 10, or 15 percent shares, so the size of any individual state’s bill is not yet public even though the underlying data already is. States above the threshold also have to file a Corrective Action Plan with the agency laying out how they intend to fix the root causes of their errors, and some may face a separate financial penalty tied to the same quality-control process described on the agency’s SNAP quality control page. Until now, the federal government paid the full cost of SNAP benefits nationwide while states covered only administrative expenses, so a state-level benefit cost share of any size marks a structural change to how the program has historically been funded.
Which States Cleared the 6 Percent Line — and Which Fell Furthest Short
Only 10 of the 53 states and territories measured came in under the 6 percent threshold. South Dakota posted the lowest error rate in the country at 2.47 percent, followed by Idaho at 3.85 percent, Wyoming at 3.96 percent, Kentucky at 4.70 percent, Iowa at 5.34 percent, the Virgin Islands at 5.36 percent, Vermont at 5.38 percent, Utah at 5.54 percent, Wisconsin at 5.72 percent, and Nebraska at 5.90 percent. Several other states missed the cutoff only narrowly, including Nevada at 6.22 percent, West Virginia at 6.69 percent, and Ohio at 6.76 percent. At the opposite end, Alaska posted the highest rate in the nation by a wide margin, at 23.15 percent, with the District of Columbia next at 18.66 percent and New Mexico at 16.81 percent. Large states carry outsized weight in the national average because the measure is weighted by caseload, so California’s 10.93 percent and Florida’s 12.97 percent both push the 10.62 percent national figure upward on their own.
What the New Rule Does Not Yet Settle
A rate above 6 percent does not by itself tell a household anything about whether its own benefit was calculated correctly; the payment error rate is a statistical sample of how states are administering the program, not evidence of individual fraud. The agency also applies a rounding tolerance to the underlying data: for fiscal year 2025, individual case errors below $57 are not counted toward a state’s rate at all, a threshold the department adjusts annually. What the cost-share rule does settle is that, for the first time in the program’s history, a state’s own administrative performance will directly determine a slice of its SNAP budget rather than being fully absorbed by federal dollars. Historical error-rate data going back more than two decades, cataloged on the agency’s payment error rate archive, shows the national rate has moved within a fairly narrow band over the years, which is part of why a 6 percent statutory line, rather than a moving target, was written into the new cost-share formula.
The full state-by-state table, current as of its June 24, 2026 release, remains the only official accounting of where the nation’s food-assistance dollars are landing in error, and it is the document each affected state will have to reconcile against when its Corrective Action Plan comes due.
Separate from SNAP, several other benefit programs go unclaimed for a similar reason: nothing about them arrives automatically. Medicare Savings Programs can eliminate a retiree’s Part B premium once income falls under a state-set line, LIHEAP helps offset a winter heating bill, and many counties run a senior property-tax relief program that lowers what a homeowner owes each year. A household has to apply for each one, and the income cutoff differs state by state. The Benefits Checklist is built around that gap: a 51-page guide to the 2026 income limits for each program, a 50-state directory of which office to contact, and a printable tracker for keeping the paperwork straight.
This article was produced with AI assistance and reviewed by a human editor. Figures are linked to their primary sources; where a claim could not be verified from the public record, we say so.