USDA’s Economic Research Service puts next year’s grocery price increase at 2.1 percent. Read one paragraph further in the same August 25 update and that tidy number turns into a range: food-at-home prices could fall 5.7 percent in 2027, or they could climb 10.5 percent, and either outcome would still count as the forecast working exactly as designed. If you build next year’s grocery line item around 2.1 percent alone, you’re skipping the number USDA itself says matters more — how wide the band around it really is.
What USDA’s 2.1 Percent Grocery Number Actually Covers
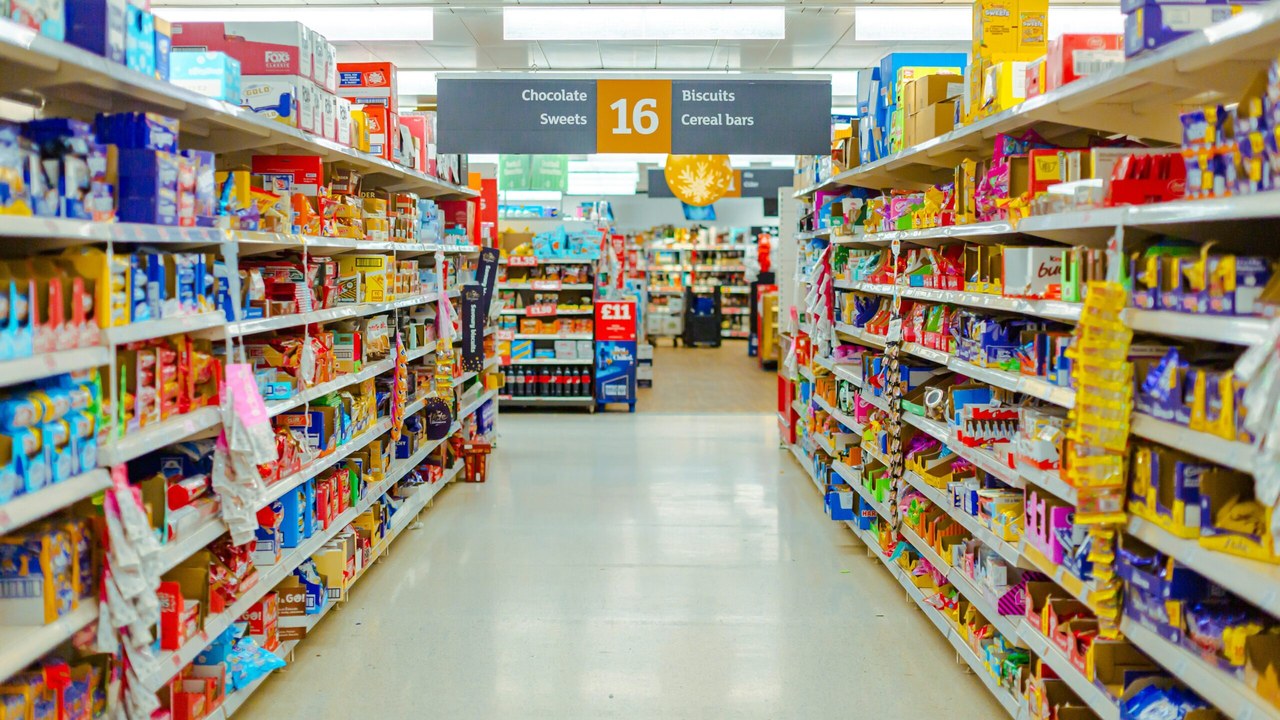
The Economic Research Service’s Food Price Outlook, last updated August 25, 2026, tracks three separate series, and the headline number depends on which one you’re reading. For 2027, ERS forecasts all food prices up 2.4 percent, food-at-home prices — what you pay at a grocery store or supermarket — up 2.1 percent, and food-away-from-home prices, meaning restaurants and other foodservice, up 2.7 percent. The 2.1 percent figure belongs to groceries specifically. It is lower than the all-food average and nearly a full point below the restaurant forecast, so a headline that just says “food prices” without naming the series is already blurring three different numbers into one.
ERS midpoints move in that direction because grocery inflation has been cooling: food-at-home prices rose 5.0 percent in 2023, slowed to 1.2 percent in 2024, ticked up to 2.3 percent in 2025, and are forecast at 2.5 percent for 2026 before easing slightly to 2.1 percent in 2027, according to the same report.
Free retirement updates: One number can cost or save hundreds a month in retirement. The free Retirement Shield newsletter surfaces the ones worth knowing. Sign up free.
Why The Forecast Interval Is This Wide A Year Out
USDA doesn’t just publish a midpoint. Since 2023, ERS has attached a 95-percent forecast interval to every number in the Food Price Outlook — a range built so that, based on how the model has performed against actual data in the past, the real outcome should land inside it 19 times out of 20. For 2027 food-at-home prices, that interval runs from minus 5.7 percent to plus 10.5 percent, the widest band of the three series (all food spans -3.0 to 8.1 percent; food-away-from-home spans 0.0 to 5.5 percent). ERS explains in its own methodology write-up that these intervals start wide at the beginning of a forecast period and narrow as more months of real Consumer Price Index and Producer Price Index data come in. For a full explanation of how the bounds themselves are calculated, ERS also keeps a technical documentation page for the Food Price Outlook.
Groceries carry the widest range because the mix of items behind that number — beef, eggs, fresh produce, sugar — is more exposed to weather, disease outbreaks like avian flu, and farm-level price swings than a restaurant menu, which changes slowly and absorbs cost shocks over time. The same August update shows farm-level egg prices alone forecast to move anywhere from -85.5 to -75.2 percent in 2026, an extreme swing that feeds into how uncertain the broader grocery number has to be a year ahead.
What A Swing From Minus 5.7 To Plus 10.5 Percent Costs A Household
Put those bounds in dollars and the range stops feeling academic. Say your household spends $500 a month on groceries — a round number, not a claimed national average. A year that lands at the bottom of USDA’s interval, minus 5.7 percent, would save you roughly $342 over 12 months. A year that lands at the top, plus 10.5 percent, would cost you about $630 more than this year. That’s a $972 swing between the best and worst case USDA considers plausible, on the same $500-a-month household, before you even touch the 2.1 percent midpoint everyone quotes as if it were a guarantee.
How Much The Same Forecast Has Already Narrowed For 2026
You can see the discipline behind the wide 2027 band by comparing it to what ERS now says about 2026, a year that’s nearly over. The same August 25 report puts 2026 food-at-home prices at a 2.5 percent midpoint with an interval of just 1.7 to 3.3 percent — a 1.6-point spread, versus 16.2 points for 2027. The gap isn’t sloppiness; it’s math. By August, ERS has seven months of actual 2026 Consumer Price Index and Producer Price Index data feeding the model, while the 2027 forecast is still working from zero observed months. ERS’s own update and revision history shows this pattern repeats every year: each forecast interval shrinks, month by month, as the year it covers gets closer and then arrives.
Building A Grocery Budget Around A Range, Not One Number
None of this means ignore the 2.1 percent midpoint — it’s still USDA’s single best estimate, and it’s the number to use for a baseline budget line. But treat it as a starting point you’ll need to revise, not a figure you can lock in for 13 months. Build in room toward the upper bound if your household budget is tight, keep an eye on ERS’s monthly updates rather than this one snapshot, and don’t overreact to any single month’s Consumer Price Index reading — the interval exists precisely because USDA expects the number to move around before 2027 arrives. ERS updated this page most recently on August 25, 2026, and by its own published cadence, it will revise the 2027 range again well before there’s enough real data to know whether groceries land near the 2.1 percent midpoint, the minus-5.7 floor, or the plus-10.5 ceiling.
This article was produced with AI assistance and reviewed by a human editor. Figures are linked to their primary sources; where a claim could not be verified from the public record, we say so.
More Financial Reading