Dental care got cheaper in August while the price of a hospital stay, a doctor’s visit, or a prescription barely moved at all, according to the Bureau of Labor Statistics’ latest Consumer Price Index. The overall medical care index fell 0.2 percent for the month — a rare monthly decline — even though medical costs are still running higher than a year ago. The pattern inside the report is uneven: some medical costs eased in August, others simply stood still, and the yearly totals tell yet another story. For retirees managing a fixed monthly budget, the difference between a price that is rising and one that is flat can matter as much as the sticker price itself.
Two Different Ways The Government Measures Medical Costs
The report separates medical costs into two broad buckets: medical care commodities, which includes prescription drugs and medical supplies, and medical care services, which covers what a hospital, dentist, or physician actually charges for care. August’s numbers moved unevenly across that divide, with the services side essentially flat and the one real decline concentrated in a single category, dental care. That divide matters because commodities and services do not move the same way over time — commodities like drugs and supplies are more exposed to competitive pricing and generic substitution, while labor-intensive services like hospital stays and physician visits have tended to rise more consistently year after year.
Free retirement updates: Miss an enrollment or claim deadline and it may be gone. Our free Retirement Shield newsletter keeps readers ahead of the ones that matter. Get the free newsletter.
Dental Care Got Cheaper While Everything Else In Medicine Stood Still
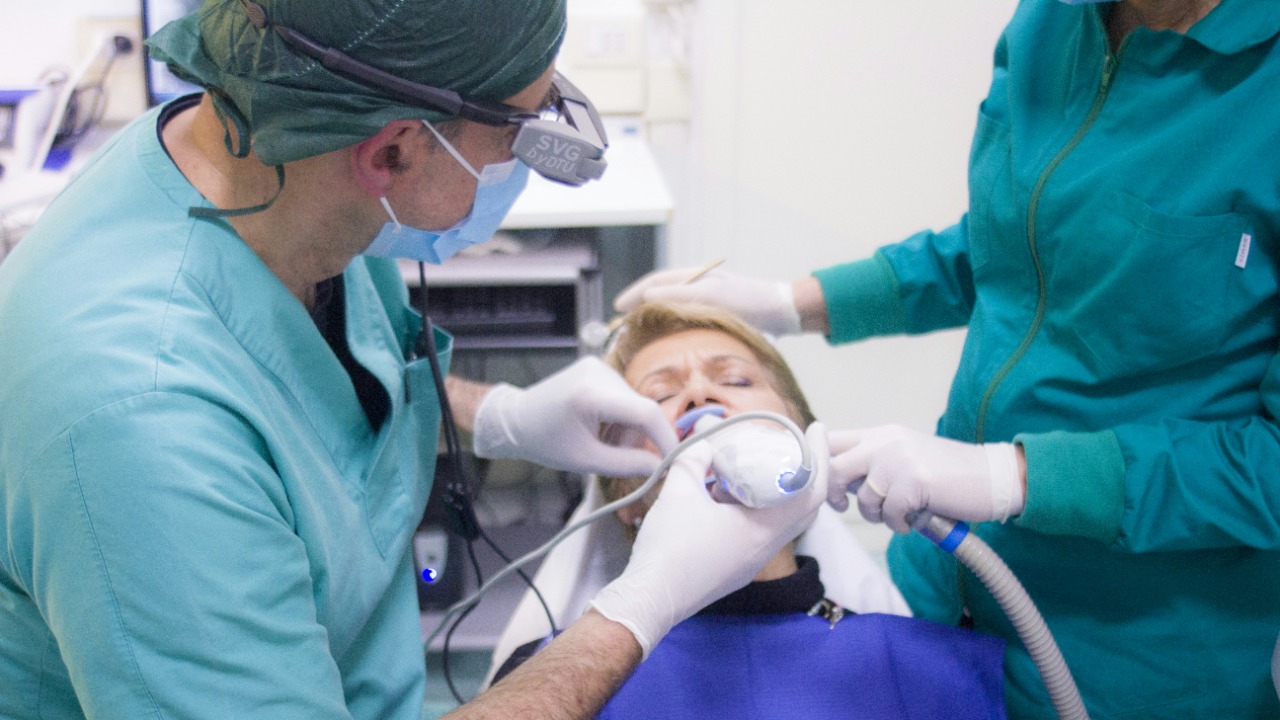
Dental services fell 0.6 percent in August, according to the Bureau’s Consumer Price Index Summary, while the hospital services index, the physicians’ services index, and the prescription drugs index were all unchanged for the month. That combination — one category falling, three others frozen — pulled the overall medical care index down 0.2 percent in August, after it had risen 0.4 percent in July. Even with that monthly dip, the same report shows medical care up 1.6 percent over the twelve months ending in August, alongside other categories with notable yearly increases like airline fares and personal care. Dental services themselves illustrate how a single month can misrepresent a full year: the category is actually up 5.0 percent over the twelve months ending in August, one of the larger yearly increases inside the entire medical care index, even though it fell 0.6 percent in the most recent month alone. A patient comparing this August’s dental bill to a year earlier would see a meaningfully higher charge; comparing it to July’s bill, a slightly lower one.
The government’s more detailed breakdown shows why the “hospital services” line looks frozen in August while a related, broader category does not. Hospital and related services as a whole — which folds in hospital services along with nursing homes, adult day services, and home health care — rose 5.5 percent over the twelve months ending in August, according to the Bureau’s detailed expenditure table, even though the narrower hospital services component it reports separately was flat for the month. Two of the categories inside that broader group moved sharply: nursing homes and adult day services rose 4.6 percent over the year, and home health care rose 10.6 percent, the fastest-moving medical services line in the entire report. Both carry relatively small weights in the national basket — 0.221 percent and 0.228 percent, respectively — but both matter disproportionately to households actually paying for long-term or in-home care rather than a single doctor’s visit.
The Full-Year Picture: Services Up, Commodities Down
The Bureau’s detailed price index table puts the medical care services index at 653.623 in August, down slightly from 654.347 in July, even as it remains 2.5 percent higher than a year earlier. Medical care commodities — which includes prescription drugs and other health products — fell to 405.528 from 406.462 and are down 2.7 percent over the full twelve months, the only major piece of the medical care index actually cheaper than it was a year ago. Inside that commodities decline, prescription drugs specifically are down 2.9 percent over the year, though the index for them was unchanged in August; nonprescription drugs are down 2.0 percent over the year and still falling, off another 1.0 percent in August after a 1.2 percent drop in July; and medical equipment and supplies, down 2.3 percent over the year, actually turned upward in August, rising 1.0 percent for the month. One more services line moved in an unusual direction: health insurance itself, as measured in the index, is down 8.5 percent over the twelve months ending in August, a decline that has been remarkably steady — down 0.5 percent in June, 0.2 percent in July, and 0.5 percent in August — even as the medical services patients actually buy with that insurance kept getting more expensive.
For a household paying $600 a month combined for prescription drugs, dental work, and physician visits, applying each category’s own twelve-month change directly — a 2.9 percent decline on the drug portion, a 5.0 percent increase on dental, and a 2.0 percent increase on physician charges — shows how unevenly a single “medical costs” line can move even inside one family’s own budget, with part of the bill shrinking while other parts grow at more than twice the pace of overall inflation.
Medical Care Moved Against The Grain This Month
Medical care’s monthly dip is the exception in this report, not the rule. Most of the rest of the index kept climbing: the Bureau’s Consumer Price Index home page puts the overall increase at 0.4 percent for August and 3.4 percent for the year, meaning the broader cost of living moved in the opposite direction from medical care in the identical month. Inflation reports routinely show that split — some categories cooling while others heat up at the same time.
One Month Of Data Is Not The Whole Story
Everything above is drawn from prices collected through August, and the Bureau is due to publish the September figures on October 14. That release will show whether medical care’s monthly dip was a pause or the start of a trend, and whether dental care’s one-month decline was an isolated move or the start of a broader pullback in what patients pay for routine care.
Where the help is written down
The programs that lower Medicare costs each run on a different form and a different office, and no single notice lists them together.
The Medicare Cost & Coverage Protection Kit includes a 10-page kit, 51 state Medicare cost-help packs and the new Part D out-of-pocket cap.
See the state cost-help packs in The Medicare Cost & Coverage Protection Kit.
This article was produced with AI assistance and reviewed by a human editor. Figures are linked to their primary sources; where a claim could not be verified from the public record, we say so.