Prices crept higher again in July, and the pump is still where households feel the sting most. The Bureau of Labor Statistics reported that consumer prices rose 0.1% for the month, a return to rising prices after they slipped in June, and sat 3.4% above where they were a year ago. Gasoline actually fell over the month, but it remains almost 25% more expensive than it was last summer. Here is what the July inflation report means for an ordinary budget.
What the July numbers actually say
The July Consumer Price Index rose 0.1% on a seasonally adjusted basis after falling 0.4% in June, and the all-items index was up 3.4% over the past 12 months, according to the Bureau of Labor Statistics. Strip out the volatile food and energy categories and “core” prices rose 0.2% for the month and 2.5% over the year. That is still above the 2% pace the Federal Reserve treats as normal, which is why inflation continues to show up in what you pay.
The single biggest driver was housing. The shelter index, which covers rent and the rental value of owned homes, rose 0.1% in July but accounted for roughly two-thirds of the entire monthly increase, and it is up 3.2% over the year. For most households, the rent or mortgage is the largest line in the budget, so even modest shelter inflation carries a lot of weight.
Free retirement updates: One number can cost or save hundreds a month in retirement. The free Retirement Shield newsletter surfaces the ones worth knowing. Sign up free.
Why gas fell for the month but is still up sharply for the year
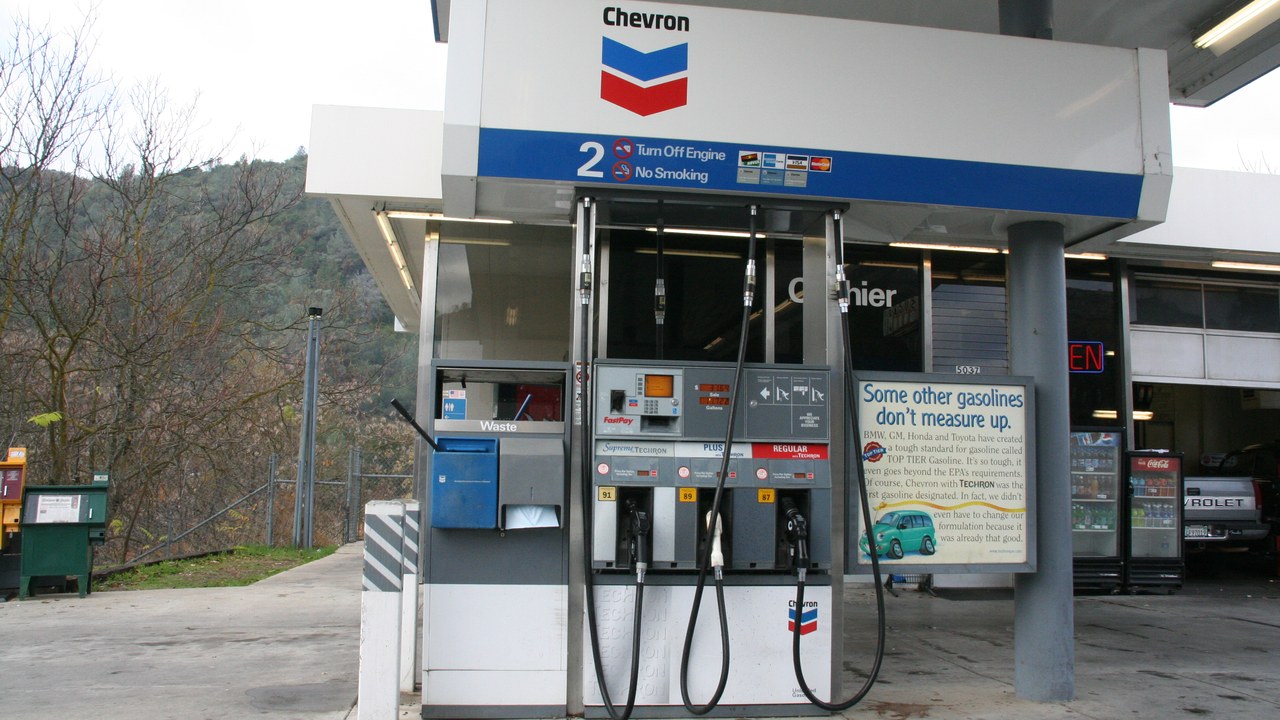
The gasoline story looks contradictory at first. Prices at the pump dropped 2.9% in July, one of the reasons the monthly increase stayed small. Yet gasoline is still 24.6% higher than it was a year ago. Both can be true at once. A year ago, gas prices were unusually low, and they climbed hard through the spring, with the gasoline index jumping more than 21% in a single month in March. Recent monthly declines have not been enough to undo that run-up, so the year-over-year comparison stays high even as the trend has turned lower.
The wider energy picture is mixed. The overall energy index fell 1.5% in July but is up 14.7% over the year, while natural gas and electricity each posted small monthly gains. For a household that drives to work or heats with gas, energy remains one of the least predictable parts of the monthly budget.
Where households are getting a break
Not everything moved the wrong way. Groceries dipped slightly in July, with the food-at-home index down 0.1% for the month. The meats, poultry, fish, and eggs group fell 0.7%, helped by a drop in pork prices, and dairy is down 0.5% over the past year. Prescription drug prices also declined for the month. Those are the kinds of small reversals that ease the pressure on a fixed grocery or medicine budget, even if they do not erase the bigger increases of the past year.
The problem is that the categories getting cheaper tend to be smaller slices of spending than the ones still rising. A little relief on eggs does not offset a rent increase, which is why the headline rate can feel worse than any single grocery run suggests. Some services kept climbing too, with airline fares up more than 25% over the year and medical care and recreation both higher, so the mix of what is rising and falling depends heavily on how a given household spends.
What a 3.4% inflation rate does to a household budget
The practical meaning of 3.4% inflation is that a basket of goods and services that cost $1,000 a year ago costs about $1,034 now. For a retiree on a fixed income or a worker whose pay has not kept pace, that gap has to come from somewhere, usually savings or spending cuts. When prices rise faster than income, the standard of living quietly erodes even if the paycheck looks the same.
There is a benefit angle too. Social Security’s annual cost-of-living adjustment is tied to inflation, and readings like July’s feed into the calculation for next year’s increase, which the government announces in October. A higher inflation reading generally points to a larger adjustment, though the exact figure depends on the summer and early-fall data.
What to watch next
One month does not make a trend, and the June-to-July reversal shows how quickly the monthly numbers can bounce. The next Consumer Price Index report, covering August, is due September 11, and it will show whether shelter keeps driving the total and whether the recent easing in gas holds. For now, the message from the July report is steady, not alarming: inflation is still running above the Fed’s comfort zone, housing is doing most of the work, and the year-over-year gas figure is a lagging reminder of how far prices climbed earlier in the year.
This article was produced with AI assistance and reviewed by a human editor. Figures are linked to their primary sources; where a claim could not be verified from the public record, we say so.
More Financial Reading