
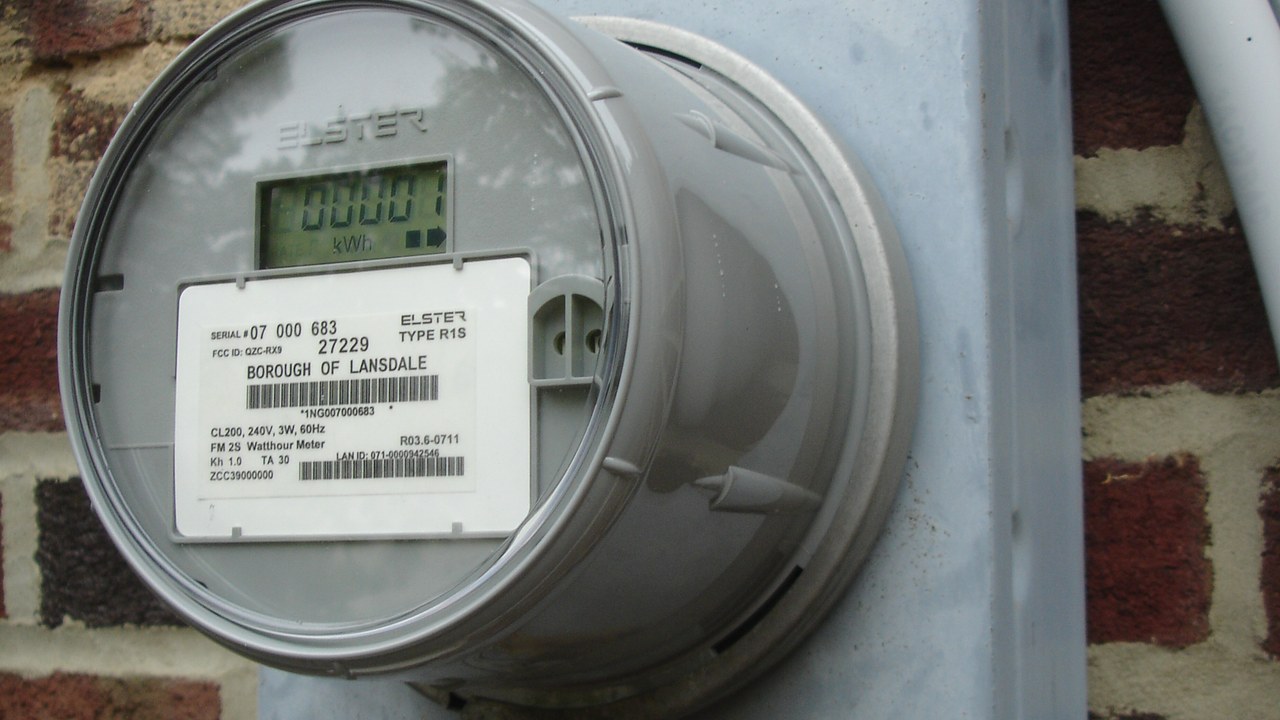
Two lines on the household utility statement moved in the August 2026 Consumer Price Index, and both outpaced the overall inflation rate. The Bureau of Labor Statistics found that electricity prices rose 3.8 percent over the 12 months ending August, while its natural gas index, which tracks piped utility gas, rose 4.4 percent over the same 12 months. Neither figure is dramatic beside the swings in motor fuel, but both land on bills that arrive every month regardless of the season.
The figures describe the 12 months through August 2026 and were published on Sept. 11. They are not a measure of what a bill costs today, and the BLS has not yet released September data.
Electricity: 3.8 percent over the year, a small dip in August
The BLS August 2026 CPI release reports the electricity index up 3.8 percent over 12 months. In August alone it fell 0.2 percent. The all items index rose 3.4 percent over the 12 months ending August, so electricity ran slightly ahead of general inflation, by four-tenths of a percentage point.
The release is a national average, and the Energy Information Administration’s Electric Power Monthly is where state and utility detail lives. Its latest edition carries data for July 2026 and was released on Sept. 24, 2026. Rates are set by state regulators and individual utilities, so a customer’s own increase can sit well above or below the national 3.8 percent.
Piped gas at 4.4 percent and the EIA price series
The natural gas index rose 4.4 percent over the 12 months ending August, a touch above electricity’s pace and well above the 3.4 percent all items rate. The EIA’s residential natural gas price table, released Sept. 30, shows the average U.S. residential price at $26.45 per thousand cubic feet in July 2026, up from $24.09 in June and $14.95 in February. That series is quoted in nominal dollars and the table, as displayed, does not show the year-earlier months, so it cannot be set against the BLS 12-month percentage directly.
The two sources measure different things. The CPI tracks the change in what households pay for the same service, while the EIA table reports an average price per unit of gas delivered. The rise from February to July in that table should not be read as an annual rate, and it should not be read as a forecast for winter heating bills.
A hypothetical $150 electric bill and $90 gas bill, rerun
Take a household whose bills a year ago were $150 for electricity and $90 for gas, both invented figures used only for arithmetic. At 3.8 percent, the electric bill becomes $155.70, a gain of $5.70 a month or $68.40 over a year. At 4.4 percent, the gas bill becomes $93.96, a gain of $3.96 a month or $47.52 over a year. Together that is $9.66 more each month, or $115.92 across 12 months.
The sums assume identical usage. A cold January or a long August heat wave moves a bill far more than a few percentage points of price. For a household on a fixed income, the more telling comparison is a benefit that adjusts once a year against bills that reprice continuously.
Why utilities rose less than the energy headline
The same release shows the overall energy index up 16.3 percent for the 12 months ending August and gasoline up 27.4 percent, which means motor fuel, not household utilities, drove most of the energy jump. Electricity rose less than a quarter as fast as gasoline over the year. That explains why a household that drives little can feel the energy headline less than the national number suggests, while a household that heats with gas or runs air conditioning through a long summer feels the smaller utility increases more steadily.
Wages matter to the comparison. The BLS Real Earnings release for August 2026 found that real average hourly earnings decreased 0.3 percent from August 2025 to August 2026, so hourly pay did not keep up with prices over the year as a whole. Real average weekly earnings rose 0.3 percent over the period, helped by hours worked.
What the percentages do not capture
A percentage change in a price index says nothing about the fixed charges, taxes and delivery fees that sit on a statement alongside the energy itself. A household with a flat monthly connection charge sees a smaller share of any bill move with the commodity price, while a household with high usage sees more. Budget billing plans, which spread a year of expected charges into equal monthly payments, can also hide a price increase until the utility recalculates the plan.
The next data point
The BLS has scheduled the September 2026 Consumer Price Index for Oct. 14, 2026, at 8:30 a.m. ET. Until that release, the August readings of 3.8 percent for electricity and 4.4 percent for the natural gas index are the latest official 12-month figures from the agency. They are national averages, and a local utility’s rate case or fuel-cost adjustment can change a household’s actual bill on a different schedule.
Where heating and cooling help gets sorted
This kit is meant for homeowners and renters who pay heating and cooling bills on a limited income and have not yet found which assistance programs cover their situation. It answers one practical question, which is where to look first.
The Senior Property Tax & Home-Cost Relief Kit has a section on heating, cooling and home-repair help and an application log and renewal calendar, so each program applied for can be tracked to its next renewal date.
Log heating and cooling help applications and renewal dates →
AI assistance was used in preparing this report; each figure above is linked to the BLS or EIA page it came from.


