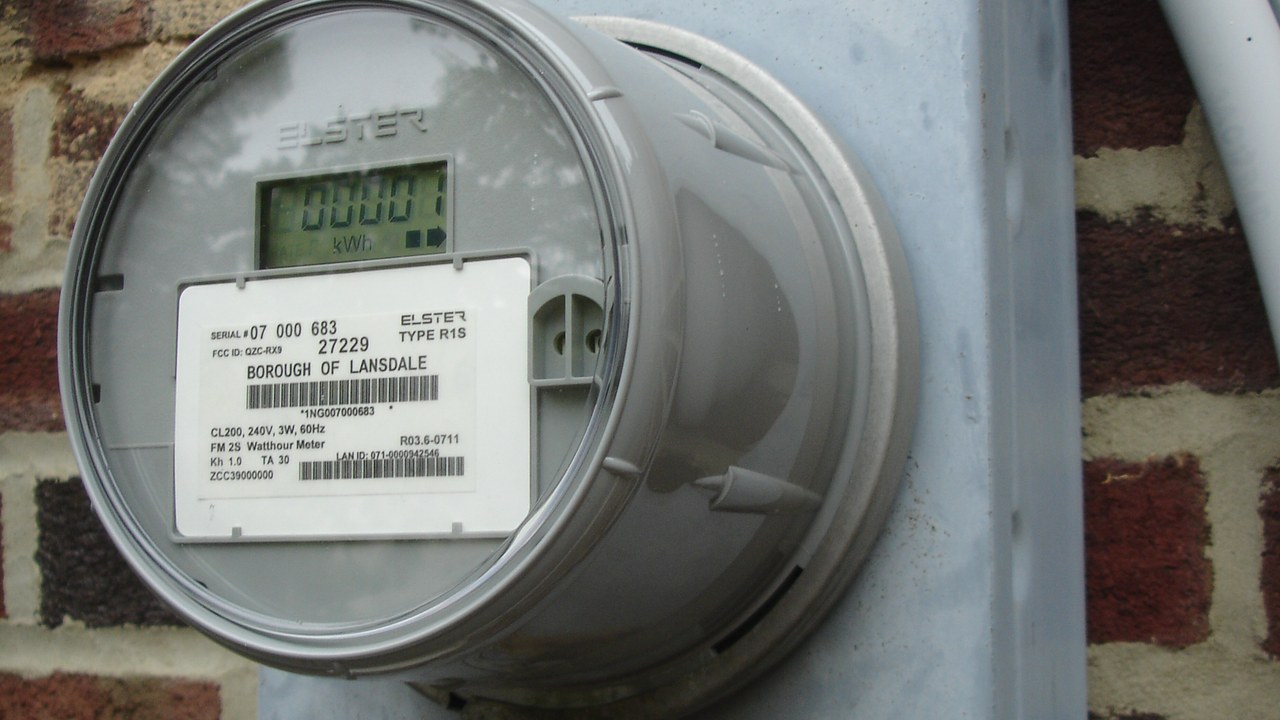
Groceries and rent are usually the two lines a household watches when it wants to know whether prices are getting worse. In the July Consumer Price Index, both of them are rising more slowly than the average, and the two utility bills are rising faster. The positions have traded, and the headline rate hides the swap by averaging it away.
Energy services are running above the 3.4 percent average
The Bureau of Labor Statistics released July’s index on August 12. Over the last 12 months, the all items index increased 3.4 percent before seasonal adjustment, which is the standard year-over-year convention and the number that gets quoted as the inflation rate.
The two household energy lines sit above it. The agency’s release states that the natural gas index increased 4.3 percent over the 12 months ending in July and the electricity index rose 4.2 percent. Combined, the energy services category rose 4.3 percent over the same period. In index terms, electricity moved from 299.107 in July 2025 to 311.672 in July 2026, and utility gas moved from 257.867 to 268.999.
Those are not dramatic numbers on their own. What makes them worth separating out is the comparison. Both are running roughly a percentage point above the all-items rate, which means the share of a monthly budget going to keeping the lights on and the house heated is growing relative to everything else, not shrinking.
Free retirement updates: One number can cost or save hundreds a month in retirement. The free Retirement Shield newsletter surfaces the ones worth knowing. Sign up free.
The 2.9 percent figure is rent paid by renters, not housing costs overall
The 2.9 percent belongs to a specific index called rent of primary residence, which measures what tenants actually pay to their landlords. Its index level went from 435.489 in July 2025 to 447.963 in July 2026. That is the figure below the headline rate, and it applies to renters.
The broader shelter index is a different number and it is not below the average. Shelter rose 3.2 percent over the same 12 months, and owners’ equivalent rent, the component that estimates what a homeowner’s dwelling would rent for, also rose 3.2 percent. At 3.2 percent, both sit three-tenths of a point above the renter figure and within two-tenths of the all-items rate, so neither is anywhere near as soft as the 2.9 percent suggests. Reading 2.9 percent as the cost of housing in general would be wrong.
One more clarification is worth making, because the direction gets garbled constantly. None of these indexes fell. Rent of primary residence rose by 2.9 percent over the year. It simply rose more slowly than the average of everything the bureau measures, which is a different statement from rents coming down.
Food at home rose 2.7 percent, the slowest of the four
Groceries are the softest line of the group. The index for food at home rose 2.7 percent over the 12 months ending in July, moving from 313.263 to 321.643. That is seven-tenths of a point below the all-items rate and the lowest of the four categories under discussion here.
It is also the category with the longest memory attached to it. Food-at-home prices climbed steeply enough during the 2022 and 2023 period that a 2.7 percent annual increase can still feel like nothing has improved, because the index measures the change from last year’s level rather than the distance back to some earlier baseline. A slower rate of increase does not undo a previous increase, and nothing in the bureau’s table of 12-month changes claims otherwise.
A metered bill is not a shopping decision
The split has a practical shape to it. Food at home and rent are the two categories where a household retains some behavioral control. Groceries can be substituted, brands traded down, a store swapped for a cheaper one, and a lease can eventually be moved even if moving is expensive and disruptive. Those choices are unpleasant, but they exist.
Electricity and piped gas do not work that way. They arrive as a metered bill set largely by regulated rates and by the weather, and while consumption can be trimmed at the margins, the bill is not a purchase anyone selects in advance. The two categories running fastest in the July data are the two that a fixed-income household can do the least about, and that is the practical content of the difference between 4.3 percent and 2.7 percent.
The next reading lands September 11
These figures are the current official numbers until the following month’s release. The bureau’s next Consumer Price Index publication is scheduled for September 11, 2026, at which point the 12-month comparisons will shift forward a month and these July readings become historical.
The underlying release, USDL-26-1378, was issued on August 12, 2026, and the full table of unadjusted 12-month changes is published alongside it in the bureau’s Consumer Price Index program materials. In that table, for July 2025 to July 2026, the entries read: all items 3.4 percent, utility piped gas service 4.3, energy services 4.3, electricity 4.2, shelter 3.2, rent of primary residence 2.9, and food at home 2.7.
This article was produced with AI assistance and reviewed by a human editor. Figures are linked to their primary sources; where a claim could not be verified from the public record, we say so.
More Financial Reading