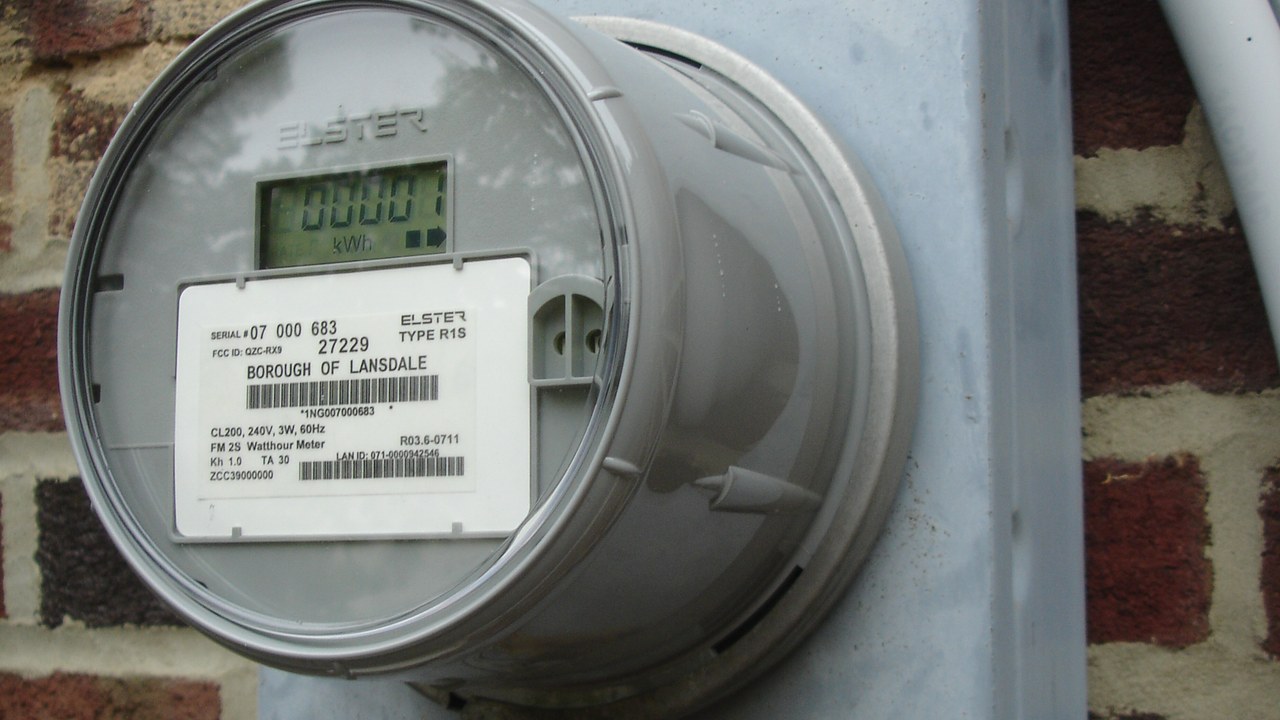
Rate increases at electric and gas utilities have stopped being a local story. A running tally kept by the Center for American Progress and the Natural Resources Defense Council now counts 275 utilities that have raised rates, won approval to raise them, or asked to raise them since the start of 2025. Together those cases touch more than 116 million electricity customers — and the tracker publishes a spreadsheet that lets a household find its own utility in the list.
What the 116 million figure actually counts
The rate-hike tracker, last updated August 5 with data the authors say is accurate as of July 31, describes its own scope carefully: utilities that “have already implemented increases, been approved for increases, or are proposing an increase starting in 2025 or later.” Those cases affect more than 116.4 million electricity customers and more than 59.7 million natural gas customers across 49 states and Washington, D.C. — 71% of the country’s electricity customers and 75% of its gas customers.
That blend of implemented, approved and proposed is worth pulling apart, because the three are not the same thing to a household. The tracker’s downloadable spreadsheet lists 461 individual rate cases with a status field on each one. By that field, the large majority are already done: 335 cases are marked in effect and another six are approved but not yet applied, while 120 are still requests pending before a state regulator. Weighted by customers, roughly nine in ten of the electric customers in the count are attached to an increase that is already in effect or approved. The remaining tenth — about 11.5 million electric customers — sit behind a proposal a commission has not ruled on. On the gas side the proposal-only share is larger, closer to one in five.
Free retirement updates: One number can cost or save hundreds a month in retirement. The free Retirement Shield newsletter surfaces the ones worth knowing. Sign up free.
The dollar figure, and where it lands
The tracker puts the combined bill impact at $101.4 billion by 2028 — $78.9 billion on electricity customers and $22.5 billion on gas customers. Spread across the affected population that is a national average of a few dollars a month, but averages are the least useful way to read a number like this, because rate cases are decided utility by utility and the outcomes are not close to uniform. The authors single out residents of Arkansas, New York and Massachusetts as households that could see increases of $40 a month or more.
It is worth being clear about the source. The Center for American Progress is a progressive policy organization and NRDC is an environmental advocacy group, and the framing of the tracker reflects that. The underlying material, though, is drawn from utility rate filings, which are public documents decided in public proceedings — and the spreadsheet is the reason to use it rather than the commentary around it.
Federal data shows the same direction
Independent federal figures point the same way. The Energy Information Administration’s Electricity Monthly Update reported that average revenue per kilowatt-hour in the residential sector rose 6.2% in May 2026 compared with a year earlier. That is a national figure covering every utility, not just the ones with active rate cases, and it captures the effect of increases already flowing through bills rather than the ones still pending.
The gap between those two views is the useful part. The tracker describes what utilities have asked for and won; the EIA figure describes what customers are actually paying. When the second follows the first with a lag, a household that reads only the monthly bill is always looking at a decision made a year or two earlier.
Finding your own utility, and the part of the process households skip
The tracker’s downloadable spreadsheet is the part of this worth a household’s time. It carries one row per rate case with the utility name, the state, whether the case covers electricity or gas, the status of the request, and the estimated monthly bill impact. Finding a utility in it takes about a minute and answers a question a national average cannot: whether the increase is finished, approved, or still being argued.
That last category is the one where a household still has standing. A pending rate case sits before a state public utility commission, and those proceedings take public comment before a decision. Commissions publish their dockets and their comment deadlines, and consumer advocates — many states fund an office of the ratepayer advocate or public counsel specifically to argue against increases — intervene in them routinely. None of that is a promise that a rate case gets denied. But a proposal that has not been ruled on is a different animal from a bill that has already gone up, and a customer who checks the status of their own utility’s case learns which one they are looking at.
For increases already in effect, the remaining levers are the ones utilities are generally required to offer: budget billing to smooth the seasonal swing, low-income rate discounts, and in most states a weatherization or energy-assistance program administered at the state level. Those do not reverse a rate case. They do change what the higher rate costs a specific household, which for a fixed-income budget is the number that matters.
This article was produced with AI assistance and reviewed by a human editor. Figures are linked to their primary sources; where a claim could not be verified from the public record, we say so.
More Financial Reading