Prices rose faster than paychecks in September, and the average worker’s buying power slipped. Real average weekly earnings, which adjust weekly pay for inflation, fell 0.5 percent from August to September, the Bureau of Labor Statistics reported.
The figures are in the agency’s Real Earnings release for September 2026, published Oct. 14. They cover all employees on private nonfarm payrolls and are seasonally adjusted and preliminary.
Pay edged up while prices jumped
The math behind the drop is simple. Average hourly earnings rose 0.1 percent in September, but the Consumer Price Index for all urban consumers rose 0.6 percent, according to BLS. The release says the workweek did not change, so the whole decline in weekly buying power came from pay lagging prices.
Hourly buying power took the same 0.5 percent hit. Real average hourly earnings decreased 0.5 percent from August to September, after slipping 0.1 percent in August, so buying power per hour has now fallen two months running.
In dollars, Table A-1 shows average weekly earnings of $1,300.66 in September, up from $1,298.94 in August. That is a gain of 0.1 percent, and the average workweek held at 34.4 hours. BLS also publishes the inflation-adjusted figure in 1982-84 dollars, $388.75 in August and $386.76 in September, an index-style measure rather than a number that appears on a pay stub.
The September average hourly wage was $37.81, up from $37.76 a month earlier. The BLS jobs report for September, released Oct. 2, reported the same $37.81 figure, a gain of 5 cents.
Who is affected? Nearly any household that depends on a paycheck, and especially people who drive to work, heat with a fuel that tracks energy prices, or live on a fixed budget where a gasoline jump comes out of the same dollars as groceries. The question for them is whether pay is keeping up at all.
Retirement deadlines, in your inbox: Miss an enrollment or claim deadline and the money can be gone. The Retirement Money Brief keeps you ahead of the ones that matter, every weekday.
Get the Retirement Money Brief →
We may earn a commission from links on this page.
Gasoline did most of the damage
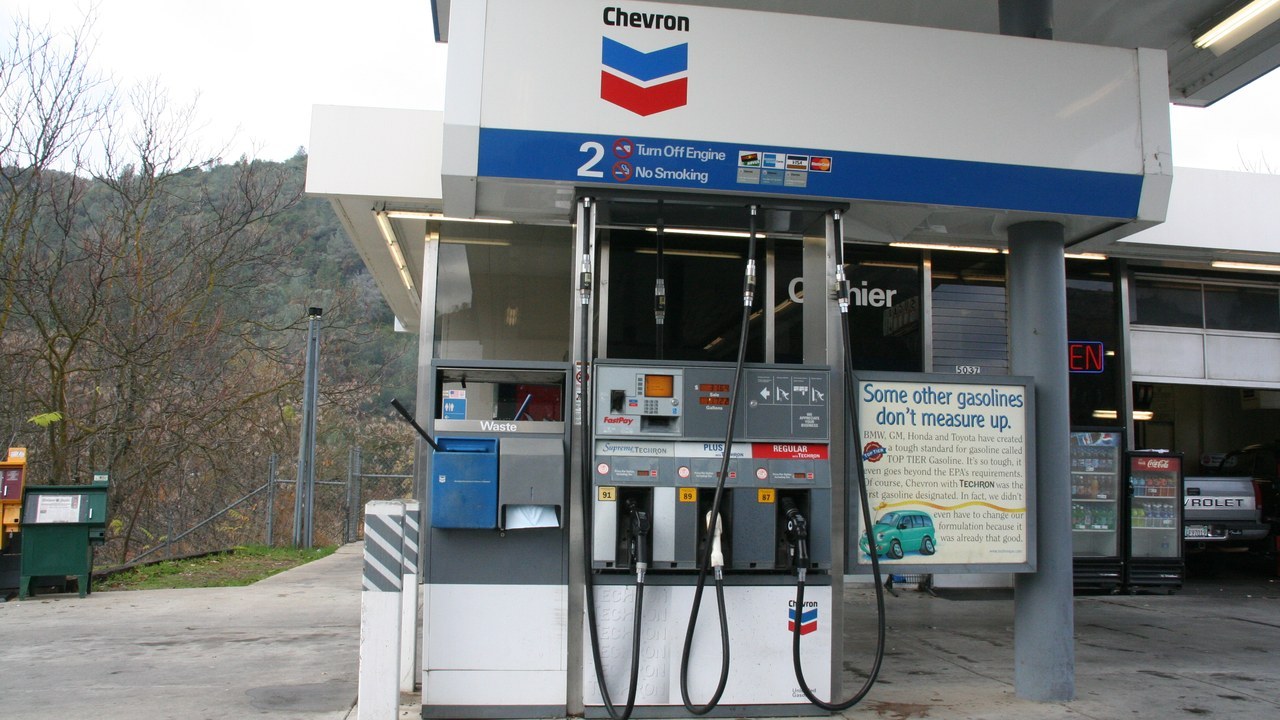
The BLS consumer price report for September says all items rose 0.6 percent after a 0.4 percent gain in August. Gasoline jumped 9.1 percent on the month and accounted for more than half of the all-items increase.
The details are in the agency’s price table. Energy as a whole rose 5.2 percent in September, and electricity was up 0.2 percent. Shelter rose 0.4 percent.
Food was quiet. Food prices were unchanged on the month, and food bought at the grocery store fell 0.1 percent.
The year-long picture is still negative, and uneven
Over the past 12 months, BLS says, real average weekly earnings are down 0.1 percent and real average hourly earnings are down 0.7 percent. Average weekly earnings rose 3.6 percent over the year, while consumer prices rose 3.7 percent.
That means a year of raises has been all but erased by inflation. Pay is up in dollars, but the hourly wage buys less than it did a year ago.
August had looked better. Real weekly earnings rose 0.2 percent that month, the Table A-1 figures show, and were up 0.4 percent over the year before September’s drop pulled the yearly number below zero.
The release also breaks out production and nonsupervisory employees, a group that leaves out managers and supervisors. Their average hourly earnings rose 0.2 percent to $32.60, but the price index used for them, CPI-W, rose 0.7 percent, and their real weekly earnings fell 0.5 percent.
Over 12 months, CPI-W is up 3.9 percent, and real weekly earnings for this group are down 0.3 percent. Real hourly earnings are down 0.6 percent. Those figures come from the same BLS release.
That group’s price index also climbed faster than the broader one for the month, 0.7 percent against 0.6 percent, which is why its real pay fell by the same 0.5 percent despite a slightly bigger raise.
Pay gains of 3.0 to 3.6 percent look solid until they are set beside the price table. Over 12 months, the same price table shows energy up 20.4 percent, gasoline up 34.2 percent, electricity up 4.4 percent and shelter up 3.2 percent.
Food has risen more slowly. Food overall is up 2.5 percent over 12 months and food at home is up 1.8 percent. Medical care services are up 2.5 percent, while medical care commodities are down 3.3 percent.
So the squeeze is not spread evenly. A household that drives a lot or pays high heating and electric bills has seen costs climb far faster than the 3.7 percent headline, while a household that mostly buys groceries has seen smaller increases.
The jobs picture behind the pay numbers is steadier. The September jobs report puts the unemployment rate at 4.2 percent, and average hourly earnings rose 3.0 percent over the past 12 months.
BLS will publish October’s Real Earnings on Nov. 10, 2026, at 8:30 a.m. Eastern. That report will show whether October’s gasoline prices and paychecks moved together or apart.
Until then, the September numbers say what many household budgets already feel. Wages grew a little, prices grew more, and the difference came out of the weekly check.
Feeling the squeeze from prices outrunning pay?
With pay down in real terms over the past year and gasoline up 34.2 percent, a household budget can slip without any single bill looking out of line. Programs that help with food, heating, health costs and property taxes each have their own income limits, and most have to be applied for.
The turn is from the wage report to the household budget. The Benefits Checklist scans 11 benefit programs, including food, heating and health-cost help, with the 2026 income limits, so a family can see which ones fit before another price jump hits.
See which benefit programs could ease the gasoline and grocery squeeze from the Benefits Checklist →
More Financial Reading
- 21 Ways to Stretch a $2,087 Social Security Check
- 15 Places to Find Your Share of the $4.25 Billion States Give Back
- 15 Ways Out of 22% Credit Card Interest
This article was produced with AI assistance and edited for accuracy against the sources linked above.