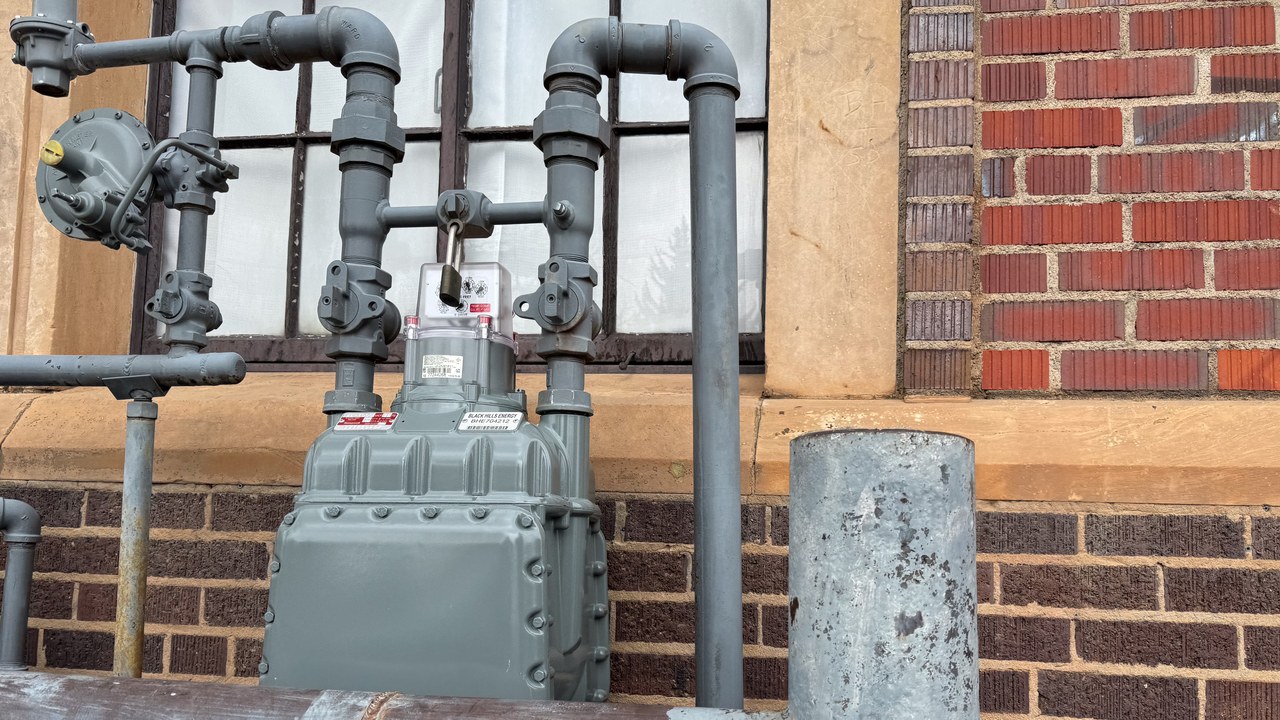
Piped natural gas delivered to homes cost 4.4 percent more in August 2026 than it did a year earlier, according to the U.S. Bureau of Labor Statistics’ Consumer Price Index. The same report shows that price actually falling during the month the data was collected. Both numbers are accurate at once, and the gap between them says something about how the government measures a bill that moves very differently across a calendar year than it does across twelve months of it.
A yearly increase that dropped during the month it was measured
The Bureau’s August 2026 news release, published September 11, lists utility (piped) gas service up 4.4 percent for the twelve months ending in August. Over the single month of August, the same seasonally adjusted index fell 1.1 percent, down from a smaller decline in July. Utility gas demand is highly seasonal — it falls in summer as furnaces sit unused and rises again once heating season starts — so the seasonally adjusted monthly figure is built to strip out that predictable summer dip. Even after that adjustment, the index still declined in August, while the twelve-month comparison, which is not seasonally adjusted, kept the full 4.4 percent yearly increase intact.
Those two readings are not in conflict. The 12-month figure compares actual prices billed in August 2026 against actual prices billed in August 2025. The monthly figure asks a narrower question: did prices move more or less than the usual seasonal pattern between July and August of this year. The answer to the first question is up; the answer to the second is down.
Inside the kit: The Senior Property Tax & Home-Cost Relief Kit lays out heating, cooling and home-repair help alongside property-tax freezes and the circuit-breaker credit that includes renters. Open The Senior Property Tax & Home-Cost Relief Kit to see how those pieces line up with a rising utility bill.
How utility gas compares with the rest of household energy
Utility gas service’s 4.4 percent yearly increase sits toward the milder end of the Bureau’s energy category. The detailed price table shows electricity up a comparable 3.8 percent over the year, while gasoline and fuel oil — the fuels tied most directly to driving and to home heating oil in parts of the Northeast — each posted far steeper increases. Combined, the full energy index — gasoline, electricity, utility gas service and fuel oil together — rose 16.3 percent over the twelve months ending in August, the largest increase among the Bureau’s major spending categories.
That places utility gas service in an unusual middle position: its yearly increase is roughly in line with electricity’s, far smaller than gasoline’s or fuel oil’s, yet still well above the overall rate of inflation for everything households buy.
Why the figure lands differently depending on how a home is heated
Not every household feels a change in utility gas service the same way, because not every household is billed for it. About 60 percent of U.S. homes use natural gas for space heating, water heating, cooking or clothes drying, according to the U.S. Energy Information Administration, a share that has held roughly steady even as some newer construction has shifted toward electric heat pumps and other all-electric systems. For that majority of homes, the 4.4 percent yearly increase in utility gas service lands directly on a recurring bill. For an all-electric household, the more relevant figure from the same Bureau report is electricity’s 3.8 percent yearly increase instead.
That distinction is one reason a single national percentage can describe two very different lived experiences. A household in a region built around piped gas infrastructure is exposed to the swings in gasoline, fuel oil and utility gas prices that make up most of the 16.3 percent energy figure. A household without a gas hookup is largely insulated from that particular number, even while facing the same broader Consumer Price Index for everything else it buys.
Where the 4.4 percent figure sits in the wider report
The all-items Consumer Price Index, covering energy, food and everything else, rose 3.4 percent over the twelve months ending in August, unchanged from July’s rate. Prices excluding food and energy — the measure the Bureau calls “core” inflation — rose 2.4 percent over the same period. Utility gas service’s 4.4 percent increase runs ahead of both of those broader measures, even though it trails the energy category’s own 16.3 percent average by a wide margin.
The Bureau said its next Consumer Price Index report, covering September 2026 data, is due October 14, 2026. That release will land as utility gas demand typically begins climbing into the fall, giving the first read on whether this August’s monthly dip continues or reverses once furnaces start running again.
A gas bill running ahead of inflation heading into the colder months
A yearly increase in utility gas service is the kind of cost that shows up on a bill every month, not a one-time expense, and it arrives right as heating season approaches. The unfinished task for a household watching that bill is knowing which forms of relief exist and which filing window applies as winter usage climbs.
The Senior Property Tax & Home-Cost Relief Kit includes heating, cooling and home-repair help alongside an application log and renewal calendar for tracking deadlines as they come due.
Look up the relief options in The Senior Property Tax & Home-Cost Relief Kit.
This article was produced with AI assistance and reviewed by a human editor. Figures are linked to their primary sources.