
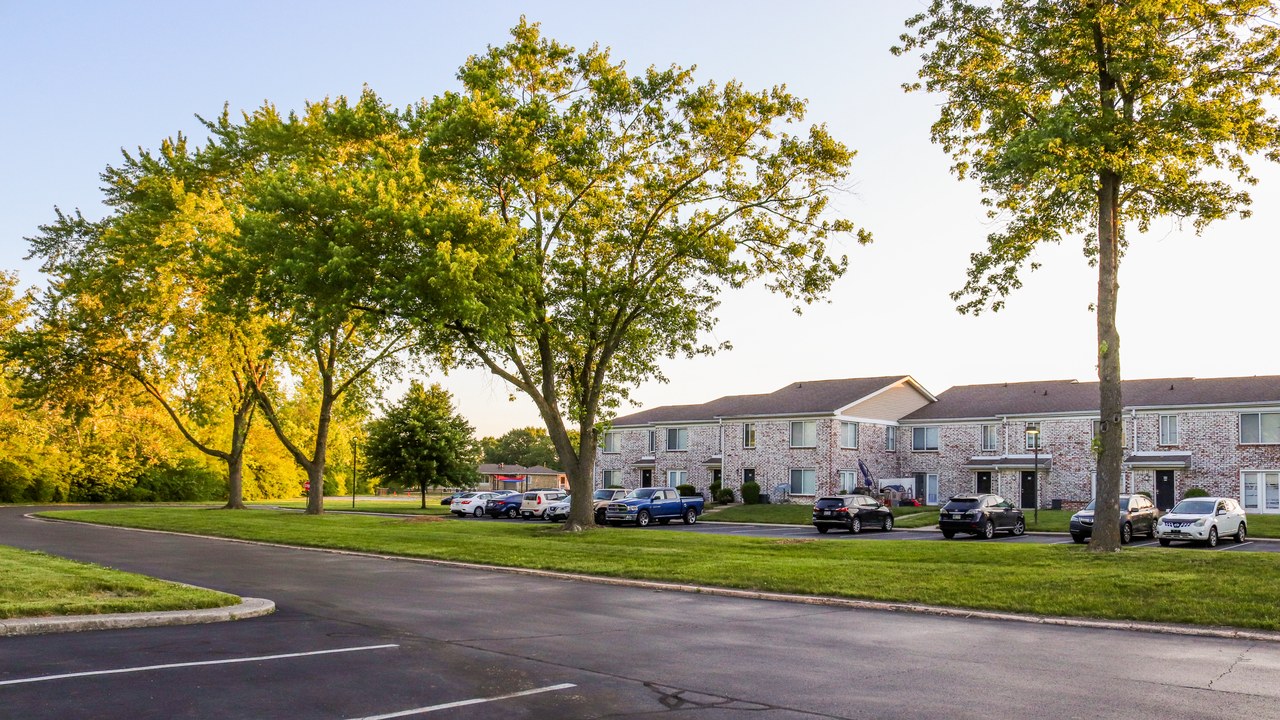
The national median rent slipped to $1,388 a month in September, Apartment List reported on Sept. 29, the first monthly decline since January. The move was 0.1%, roughly $2 below August’s $1,390, which is far too small to change any one lease. It does close a stretch of seven straight monthly increases, and it lands just as many tenants start hearing from landlords about fall and winter renewals.
A $2 dip after seven straight monthly gains
Apartment List’s September National Rent Report puts the national median at $1,388 a month and the month-over-month change at -0.1%. The August edition of the same report had the median at $1,390 and described it as the seventh consecutive monthly rise. Subtracting one figure from the other gives the $2 difference; over a full year, a $2 gap comes to $24.
The report ties the September dip to the calendar. Apartment List describes the rental market as entering its off-season, the stretch of the year when fewer households are moving. A first decline after seven increases therefore reads as a seasonal turn more than a collapse. One month of data cannot show whether the pattern holds through the winter, and the report does not claim that it will.
What the annual comparison adds
Measured against September 2025, the same report shows national rents down 0.4%. On a median near $1,388, that works out to roughly $5 or $6 a month lower than a year earlier: dividing $1,388 by 0.996 gives about $1,394 for the prior September. At $1,388 a month, a household pays $16,656 across a 12-month lease, so the yearly saving from a 0.4% decline is on the order of $65 to $70. That is real money on a fixed income, and it is also small enough that a single utility increase or a renewal fee can erase it.
The August edition put the annual change at -0.8%, so the year-over-year decline narrowed in September even as the monthly figure turned negative. The two numbers measure different things. The monthly change compares September with August, while the annual change compares September with a year earlier, so the two can move in opposite directions.
Vacancy and time on the market
Apartment List’s vacancy measure stood at 7.0% in September, down from a peak of 7.3% in February, and units took an average of 34 days to lease. Vacancy is the number that tends to matter most at renewal time, because a building with empty units has a reason to keep a current tenant at a steady price.
The Census Bureau publishes a separate and broader gauge. Its Housing Vacancies and Homeownership survey for the second quarter of 2026, released July 28, put the national rental vacancy rate at 7.3%, unchanged from the first quarter and not statistically different from 7.0% a year earlier. The Census Bureau counts all rental housing, while Apartment List’s figure describes its own measure of the market, so the two are not interchangeable. Both put roughly 7 in every 100 rental units vacant.
Why Zillow’s rent figure is higher
Readers comparing reports will notice that other trackers show much higher rents. Zillow’s August rent report, published Sept. 16, put the typical U.S. rent at $1,948 a month across all rentals, up 2.5% from a year earlier. Its typical multifamily asking rent was $1,774, up 1.9%, and single-family rentals were higher still at $2,289. Those figures cover different sets of homes and use a different method than Apartment List’s $1,388 median, so the gap between $1,388 and $1,948 is a difference in measurement and not a contradiction.
The practical point is that the direction of each series matters more than its level. Zillow’s August report showed rents still rising year over year, while Apartment List’s September report shows them slightly lower. A tenant comparing a landlord’s quote with a national headline should expect the local number, not either national one, to drive the renewal.
What a national median cannot show
A median of $1,388 hides wide variation between cities. In the same Apartment List report, San Francisco rents are up 26% over the past year and Oakland’s are up 16%, while San Antonio is down 4.3% and Las Vegas is down 3.6%. A tenant in Texas or Nevada may be looking at a lease that is cheaper than the last one; a tenant in the Bay Area is probably looking at the opposite. The national dip is an average of those very different experiences.
For older renters and homeowners on fixed incomes, the housing line in the budget is usually the biggest one, and it is also the one least exposed to a single monthly data point. Rent is set lease by lease, so a 0.1% national slip arrives in household budgets slowly, if it arrives at all. What the September number offers is context: the market that produced steady increases through August has, for one month, stopped climbing.
Apartment List’s September reading in brief
The figures in Apartment List’s report, published Sept. 29, are a $1,388 national median, a 0.1% monthly decline, the first since January, a 0.4% annual decline, a 7.0% vacancy rate and 34 days on the market. Each is the company’s own estimate for September 2026, and the next monthly edition will show whether the off-season dip deepens or reverses.
Home-cost relief for older homeowners and renters
The kit is written for older homeowners and renters who are trying to hold down the fixed costs of staying in their home, including property-tax bills, heating and cooling, and repairs. Many relief programs exist for those costs, but each has its own application and renewal schedule, which is easy to lose track of.
The Senior Property Tax & Home-Cost Relief Kit covers the 5 kinds of property-tax relief and the circuit-breaker credit that includes renters, along with heating, cooling and home-repair help, in an 11-page kit with an application log and renewal calendar.
This article was drafted with AI assistance and checked against the cited sources.


