
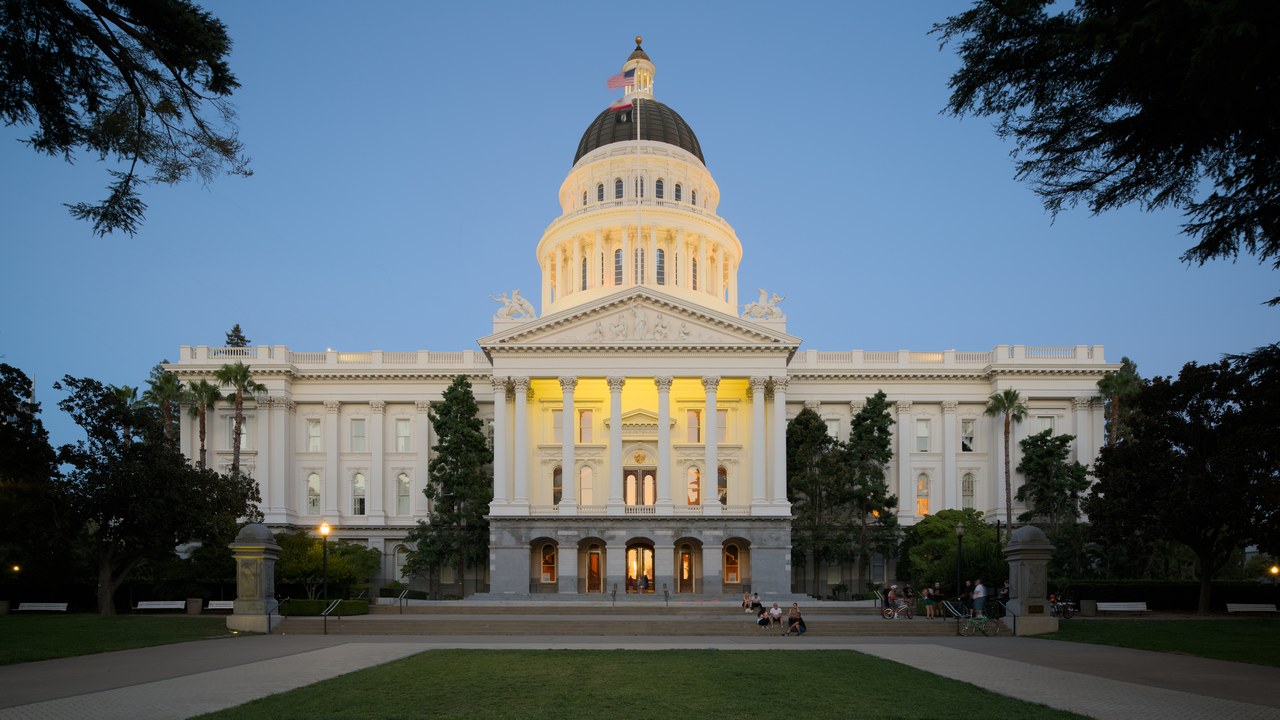
Supplemental Security Income recipients in Montana averaged $670.74 a month in August 2026, the lowest state figure in the Social Security Administration’s monthly statistics. Recipients in California averaged $852.77, the highest, a difference of $182.03 a month. The national average across all recipients was $738.73.
Table 8 puts the extremes $182.03 apart
SSA’s table of average SSI payments by state for August 2026 shows California at $852.77 and Montana at $670.74. Dividing the $182.03 difference by Montana’s $670.74 shows the California average running about 27% higher. Alaska, at $673.04, sits just above Montana, and Wyoming’s overall average is $694.11.
The figures are averages of what recipients were actually paid, federal payment and any state supplement combined. SSA’s monthly tables state that the averages exclude retroactive payments, so a one-time back payment does not lift a state’s number.
Distance from the national average
Against the $738.73 national average, California is $114.04 above and Montana is $67.99 below. The Northern Mariana Islands, a territory, shows $796.35 in the same table.
A gap of about $182 a month adds up to roughly $2,184 over a year. For a household living on the SSI check as its main income, that is a sizable gap between two states.
Table 19 and the state supplement piece
SSA’s separate table of average state supplements reports a national figure of $211.91 and $241.51 for California. Hawaii is listed at $616.40, Pennsylvania at $543.28, the District of Columbia at $469.17 and New Jersey at $36.32. The table covers 11 states plus D.C. with federally administered supplements.
These numbers show that state supplements vary enormously in size, and California’s is above the national figure. Table 19 does not list Montana, so the two tables cannot be subtracted to isolate what a supplement contributes to the $182.03 difference. SSA’s pages do not say that state supplements explain the gap, and this article does not make that claim. For scale, Hawaii’s average supplement of $616.40 is 92% of Montana’s entire average payment of $670.74.
California’s rates in SSA’s own publication
SSA’s publication SSI in California lists a monthly payment of $1,233.94 for an aged or disabled individual living independently and $1,318.32 for a blind individual. For a couple it lists $2,098.83. The blind rate runs $84.38 above the aged-or-disabled rate, and the couple figure of $2,098.83 is about 1.7 times the individual amount. The publication adds that Medi-Cal, California’s Medicaid program, is usually automatic for SSI recipients.
The California average of $852.77 sits well below the $1,233.94 individual amount. That is expected for an average, since payments are reduced by countable income. SSA’s eligibility guidance lists Social Security benefits, earnings and pensions among the income that is counted and states that “income that we do count reduces your SSI benefit amount.”
What a household budget sees in the difference
For a recipient with no other income, the SSI amount is the whole monthly budget for rent, food and utilities. A payment of $670.74 has to cover the same categories as $852.77, which makes a difference of $182.03 a month a matter of a utility bill or a week of groceries. SSA’s tables do not report the cost of living in either state, so they say nothing about how far each payment stretches.
The eligibility page also sets the resource limits that apply in every state, $2,000 for an individual or child and $3,000 for a couple, so the state-to-state differences come from payment amounts and not from a different asset test.
What a state average can hide
State averages blend recipients of different ages and circumstances. The same table 8 shows how much the mix can matter: California’s aged recipients average $725.27, while Wyoming’s aged average is $376.98, the lowest in the table, with Mississippi at $382.47 and Arkansas at $393.82. Wyoming’s aged average of $376.98 compares with $694.11 for all of its recipients, and the national aged average in the same table is $603.89.
Because SSA’s tables report averages only, a monthly figure such as $670.74 in Montana cannot be read as what any one person receives. Individual amounts depend on income, living arrangement and whatever supplement the state pays. The comparison is best read as a picture of state-by-state differences in the mix of payments, not as a ranking of how well each state treats recipients.
The state gap is also a reminder that SSA publishes these statistics monthly, so the August 2026 table is a snapshot of one month. A later release can move each state’s average, and the ordering of the states nearest the bottom can change with it.
For a family comparing states, the practical takeaway is narrow: SSA’s August 2026 table records $852.77 as the California average and $670.74 as Montana’s. The agency’s individual figures come from its own records of each person’s income and living situation.
State supplements, income limits and the SSI average
The gap between California and Montana shows how much of an SSI payment depends on the state and on countable income. Recipients and families who track these payments benefit from keeping the federal income and resource limits alongside their own records.
The SSI & Disability Action Kit is a 10-page kit that covers the 2026 SSI income and resource limits and includes an income and resource organizer for recording those figures.
Click here to get The SSI & Disability Action Kit with the 2026 SSI limits →
This article was prepared with AI assistance and checked against the cited Social Security Administration tables.


