
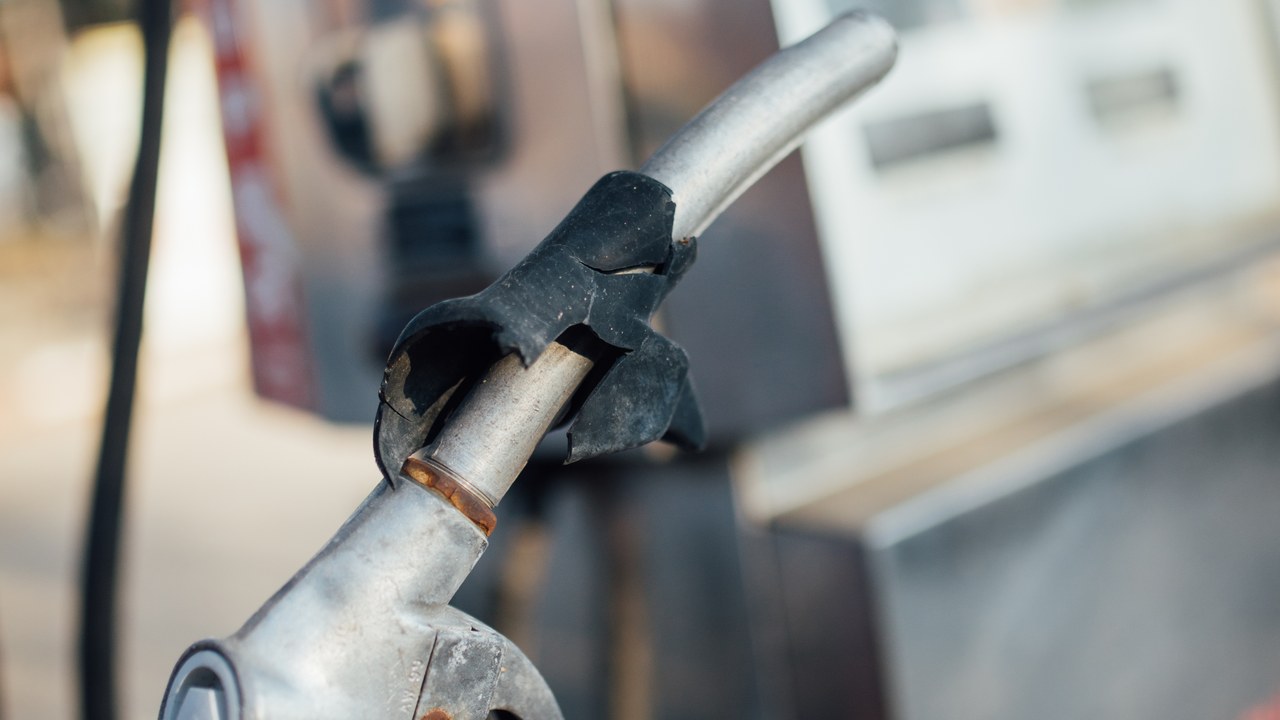
A gallon of gasoline cost 27.4 percent more in August than a year earlier, and a gallon of home heating oil cost 52 percent more, according to the Bureau of Labor Statistics’ Consumer Price Index report for August 2026. Both figures ran far ahead of the broader cost-of-living picture: the all-items index rose 3.4 percent over the same twelve months, and groceries bought at home rose just 2.2 percent. For a household that fills a gas tank every week or orders a heating-oil delivery before winter, the distance between the headline inflation number and what actually lands on the pump display or the delivery invoice is the real story behind the August report.
Gasoline’s 27.4 Percent Yearly Jump Was the Single Biggest Mover in the Report
The gasoline index climbed 27.4 percent over the twelve months ending in August, unadjusted, the largest year-over-year move of any major category the Bureau of Labor Statistics tracks in its monthly Consumer Price Index summary. On a seasonally adjusted basis, gasoline alone rose 3.9 percent in August after falling 2.9 percent in July, and the Bureau’s own release credits the August gasoline increase with more than one-third of that month’s 0.4 percent rise in the all-items index. Energy commodities as a group, which combine gasoline and fuel oil, rose 28.0 percent over the year, nearly double the 16.3 percent increase logged by the broader energy index that also folds in electricity and piped gas.
Those figures come from the same release, published September 11 as USDL-26-1496, that put the overall Consumer Price Index for All Urban Consumers up 3.4 percent over the twelve months ending in August, matching the annual rate recorded in July. The gasoline swing sits well outside that pace: a household paying $50 for a fill-up in August of the prior year needed noticeably more than $63 to buy the same tank in August 2026, based on the reported yearly percentage change, before accounting for any local price differences detailed in the Bureau of Labor Statistics’ Consumer Price Index Summary for August 2026.
Free download: Property-tax freezes, exemptions and circuit-breaker credits, plus LIHEAP and shutoff protections, and what to gather before applying. Get the free property tax and utility relief finder.
Free download from RetireShield. Getting it also signs you up for the free Retirement Money Brief, a weekday email. Unsubscribe anytime.
Home Heating Oil’s 52 Percent Increase Dwarfed Every Other Utility Cost
Fuel oil rose 52.0 percent over the twelve months ending in August, the largest increase among the individual energy categories in the Bureau’s monthly summary. That is roughly twelve times the pace of electricity, which increased 3.8 percent over the same period, and roughly twelve times the pace of utility piped gas service, which increased 4.4 percent. Fuel oil is a smaller line item in most household budgets than gasoline or electricity, but for a household that relies on it to heat a home through the winter, a 52 percent increase compounds with every delivery.
The month-to-month pattern behind that yearly figure was uneven rather than steady. Fuel oil prices rose 11.1 percent in February, 30.7 percent in March, cooled to smaller monthly moves through early summer, fell 9.2 percent in June, then climbed another 10.1 percent in August, all on a seasonally adjusted basis. Energy services broadly, a category that groups electricity and piped gas together but excludes fuel oil and gasoline, rose a comparatively modest 4.0 percent over the year, underscoring how much of the twelve-month energy increase traces back to the two fuels households buy directly rather than the utilities billed monthly.
Gasoline Moves the Index Harder Than Its Small Weight Suggests
Gasoline (all types) carries a relative importance of just 2.895 percent of the entire Consumer Price Index basket, according to the Bureau’s own motor-fuel measurement factsheet, while transportation as a whole accounts for 16.316 percent. That small weight is part of why a 27.4 percent yearly increase in gasoline prices did not, by itself, push the all-items index anywhere near that pace. But the category’s swings still show up fast in the monthly reading because gasoline prices are drawn from near-daily, station-level data rather than the monthly survey used for most other CPI categories, so gasoline reacts to crude-oil and refinery markets faster than rent, medical care, or groceries ever do.
That speed cuts against households when prices spike and works in their favor when prices fall, which is part of why gasoline swung from a 9.7 percent monthly decline in June to a 3.9 percent monthly increase in August within the same seasonally adjusted series. Fuel oil, priced through a similarly rapid-response method, showed the same kind of volatility. Core inflation, the all-items index stripped of food and energy, moved far more slowly, rising 2.4 percent over the twelve months, a full percentage point below the headline number driven up by gasoline and fuel oil.
The Twelve-Month Total Hides a Volatile Year at the Pump and the Tank
Averaged over twelve months, a 27.4 percent gasoline increase and a 52.0 percent fuel oil increase sound like steady climbs, but the seasonally adjusted monthly data behind them tell a choppier story. Gasoline rose 21.2 percent in March alone, fell 9.7 percent in June, then rose again in July and August. Fuel oil followed a similar pattern, spiking 30.7 percent in March before falling 9.2 percent in June and climbing again into August. A household budgeting off the twelve-month figure alone would miss how sharply both fuels moved within individual months, which matters for anyone timing a heating-oil delivery or a fill-up around a particular week rather than an annual average.
Households on Fixed Incomes Watch the Next CPI Reading Closely
The Bureau of Labor Statistics has scheduled its next Consumer Price Index release, covering September 2026, for October 14. That reading will show whether gasoline and fuel oil continue climbing at their August pace or whether the volatility documented in the seasonally adjusted monthly data starts to ease. Until then, the August report stands as the most current, primary-source measurement of how much more households paid for motor fuel and home heating oil over the prior year, alongside the comparatively modest 2.2 percent increase in grocery prices and the 3.4 percent increase across the broader Consumer Price Index.
Covering Property Taxes and Utility Costs While Energy Prices Climb
The August CPI report documents how much further gasoline and fuel oil prices climbed over the past year, but it does not tell an individual household which property-tax relief, circuit-breaker credit, or utility assistance program might offset some of that increase where they live. Rising fuel and energy costs often arrive at the same time as a property-tax bill or a winter utility bill, and the forms and deadlines for the relief programs meant to help rarely show up next to the news coverage of the price increases themselves.
The Senior Property Tax & Home-Cost Relief Kit lays out the five kinds of property-tax relief and the circuit-breaker credit that includes renters, along with separate help covering heating, cooling and home-repair costs.
See the property-tax and home-cost relief options in The Senior Property Tax & Home-Cost Relief Kit.
AI-assisted research and drafting; reviewed by an editor.


