Beef gets the headlines, but it is not the only grocery category running hot in USDA’s own price data this year. The Economic Research Service now forecasts sugar and sweets prices, the category that covers candy and chocolate, rising 7.1 percent in 2026. That puts it among the fastest-growing sections of the grocery store, well ahead of the 2.5 percent increase USDA forecasts for groceries as a whole, even though it rarely shows up in a cost-of-living conversation the way gas, eggs or beef do.
USDA’s Own Forecast Puts Candy Among 2026’s Hottest Categories
USDA’s Food Price Outlook, updated August 25, forecasts sugar and sweets prices climbing 7.1 percent for all of 2026, with a 95-percent confidence interval running from 6.0 to 8.2 percent. That forecast already reflects real movement through July: prices for the category rose 7.4 percent compared with a year earlier and ticked up another 0.1 percent from June to July alone. Sugar and sweets is one of just seven food-at-home categories, out of the 15 ERS tracks, forecast to grow faster than its own 20-year historical average pace in 2026 — a list that also includes beef and veal, fish and seafood, and fresh produce.
The forecast interval matters because it shows how much confidence USDA actually has in the number. A range of 6.0 to 8.2 percent is relatively tight compared with some other categories, suggesting the agency sees the underlying trend as fairly stable rather than volatile month to month.
Free retirement updates: Want plain-English help keeping more of your money in retirement? The free Retirement Shield newsletter covers the benefits, deadlines, and money mistakes that cost retirees, a couple times a week. Subscribe free.
Candy and Chewing Gum Are Doing Most of the Work
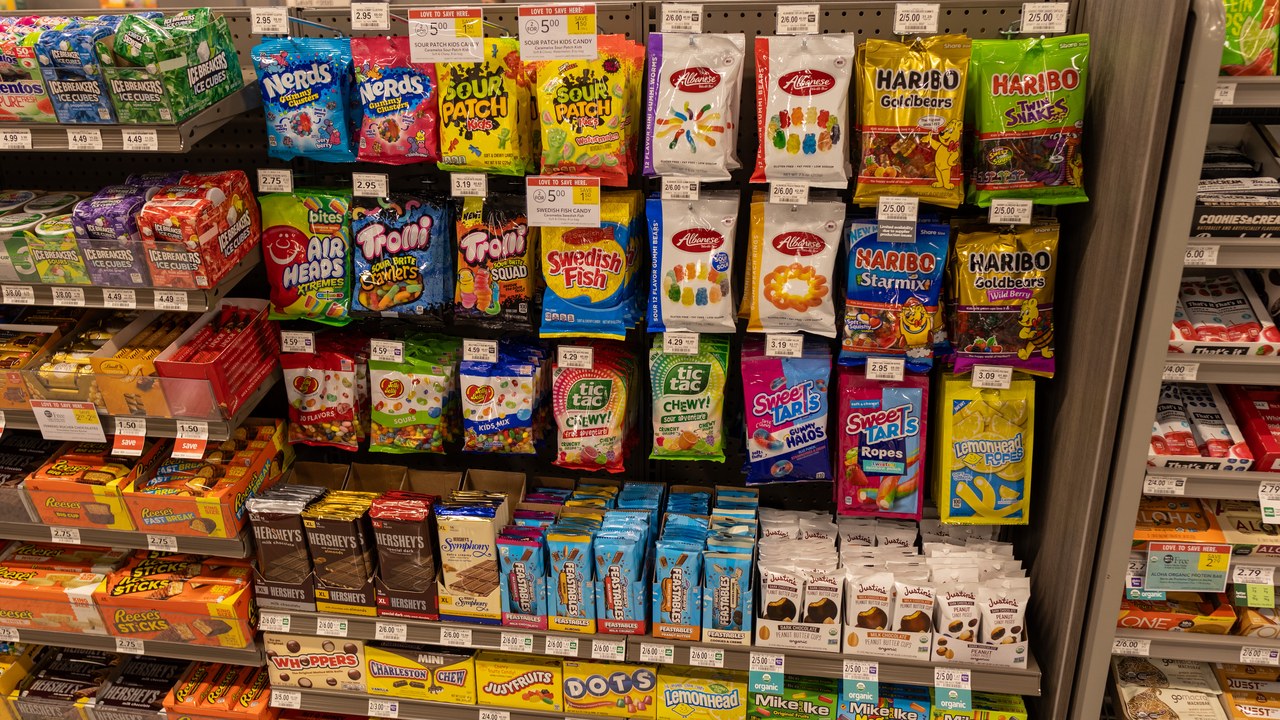
Sugar and sweets is a broad CPI category that covers everything from table sugar to jam, but USDA is specific about where the pressure is coming from. The agency’s data attributes the increase “primarily” to candy and chewing gum, a subcomponent of the category that, in USDA’s own description, “includes most types of chocolate candy.” In plain terms, a household buying a bag of chocolate for the holidays or a box of candy for a lunchbox is buying into the part of the grocery basket that is rising fastest, not the sugar or baking-aisle items that make up the rest of the category’s average.
Why This Category Rarely Makes the List of Household Money Worries
Sugar and sweets is a small line item compared with beef, gas or rent, which is part of why a 7.1 percent increase draws so little attention next to a 9.8 percent forecast for beef or a housing story that touches a monthly budget in the hundreds of dollars. But small line items add up across a year of grocery trips, birthdays, holidays and school events, and a category running nearly three times faster than the overall grocery forecast is not a rounding error. It simply lacks the single dramatic number, like a specific cut of steak’s price tag, that tends to generate attention.
How This Compares With the Rest of the Grocery Aisle
Sugar and sweets’ 7.1 percent forecast sits well above fresh fruits at 2.9 percent and nonalcoholic beverages at 4.3 percent, and it trails only beef and veal’s 9.8 percent among all 15 categories USDA tracks. Fresh vegetables come in at 5.9 percent. On the other end, egg prices are forecast to fall more than 30 percent in 2026 as poultry flocks recover from avian flu losses, and dairy prices are expected to hold roughly flat, a reminder that “grocery inflation” is not one uniform number but a collection of very different trends moving at different speeds within the same shopping cart.
Raw Sugar Supply Isn’t the Culprit
The rising shelf price is not being driven by a shortage of raw sugar itself. USDA’s separate Sugar and Sweeteners Market Outlook, updated August 19, actually raised its forecast for U.S. 2026/27 sugar supply to 14.436 million short tons, up 169,000 tons from the prior month, with the stocks-to-use ratio improving to 14.8 percent from 13.5 percent — a sign of more supply relative to expected use, not less. That distinction matters: it points toward the cost pressure sitting in how candy and chewing gum are manufactured, packaged and priced at retail, rather than in the cost of the sugar that goes into them. USDA’s August 2026 Sugar and Sweeteners Outlook report even devotes a section specifically to prices received by domestic sugar-crop growers, tracking that farm-level side of the market separately from the retail candy shelf.
What Could Change the Forecast From Here
ERS updates its Food Price Outlook every month as new Consumer Price Index and Producer Price Index data become available, and the sugar and sweets forecast has moved before as input costs for sugar, cocoa and packaging shift. The next update will fold in August’s inflation data, giving USDA a clearer read on whether the candy and chewing gum category continues climbing at its current pace or whether, like beef’s forecast the previous month, the number moderates as more of the year’s actual price data comes in.
This article was produced with AI assistance and reviewed by a human editor. Figures are linked to their primary sources; where a claim could not be verified from the public record, we say so.
More Financial Reading