
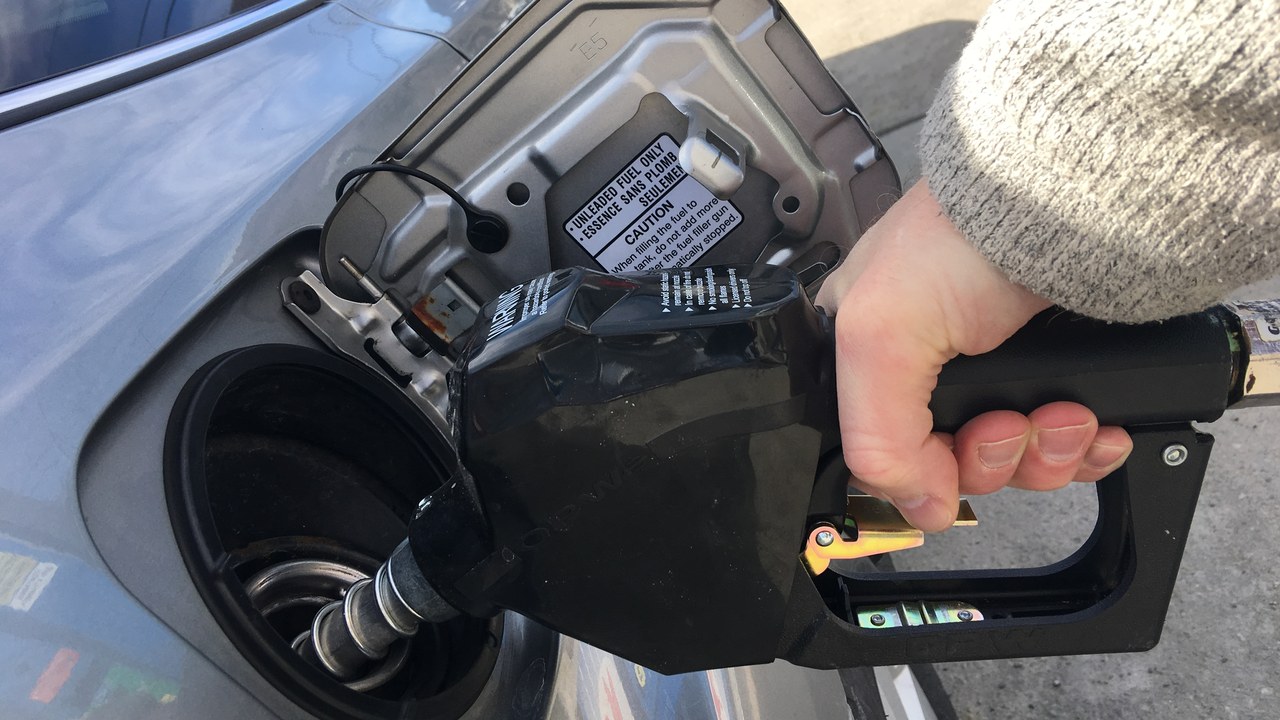
September was the most expensive September on record for gasoline. AAA says the national average for the month came to $4.33 a gallon, which is 50 cents above the previous September record of $3.83, set in 2023. The motor club announced the figure in its weekly gas price report on Oct. 1.
The record covers one month of the calendar. It does not say that $4.33 is the highest monthly average ever, only that no earlier September came close.
Drivers on fixed incomes want to know two things: whether the record month was the top of the climb, and how long pump prices will stay this high. The latest numbers show a small retreat, with gas still far above where it was a year ago.
This story is not finished, and The Retirement Money Brief will cover the next step in plain English when pump prices or the rules around them move again.
Get the next update free → Free from RetireShield. Unsubscribe anytime.
A 50-cent jump over the old September mark
AAA’s report compares the month with earlier Septembers. The old record of $3.83 stood for three years. The new one beats it by 50 cents, a gain of about 13 percent.
The same report says overall gas prices remain “the highest they’ve ever been for this time of year.” That wording matters for anyone budgeting for the fall, because it covers early October as well as September.
Where prices stand since the record month
AAA said the national average for regular fell nearly 7 cents in the week before Oct. 1, to $4.41. Its daily fuel report for Oct. 6 puts the average at $4.3685, a further drop of about 4 cents.
The same page lists a week-ago average of $4.4558 and a month-ago average of $4.1473. So the price is lower than a week ago, by about 9 cents, but about 22 cents higher than it was a month ago. A year ago it was $3.1333, which puts today’s average about $1.24 higher than on the same day in 2025.
What crude oil is doing
AAA’s Oct. 1 report cites West Texas Intermediate crude at $90.42 a barrel. Crude is the largest single piece of what drivers pay. The Energy Information Administration’s price breakdown, posted with its weekly fuel update, assigns about 52 percent of the retail price of regular gasoline to crude oil, 22 percent to refining, 15 percent to distribution and marketing, and 12 percent to taxes.
With crude making up about half the price, oil at $90 a barrel is a large reason the national average stays above $4.
The federal weekly figure
EIA’s own count, a separate survey from AAA’s, put regular gasoline at $4.354 on Oct. 6. That was down 11.1 cents on the week and up $1.230 from a year ago. By region, the West Coast was highest at $5.727, with California at $6.227. The Gulf Coast was lowest at $3.911.
The spread between those two regions is about $1.82 a gallon, so drivers on the West Coast and the Gulf Coast face very different prices on the same day.
Some of the biggest weekly drops were in the Midwest. EIA’s update shows gasoline in Ohio down 43.4 cents on the week, and Cleveland down 46.7 cents. That is far larger than the 11-cent national move, and it shows how unevenly price changes arrive from one city to the next.
Gas prices versus a year ago
The record month is easier to feel in dollars than in percentages. At AAA’s Oct. 6 average of $4.3685, filling a 15-gallon tank costs about $66. At last year’s $3.1333 the same tank cost about $47, so each fill-up now runs roughly $19 higher. A household that fills up four times a month is paying about $74 more than it did a year ago.
Electric charging barely moved
AAA’s Oct. 1 report also tracked public electric vehicle charging, which stayed at 42 cents per kilowatt-hour for the week.
Planning fuel costs for the weeks ahead
The two free trackers that matter are AAA’s daily averages and EIA’s weekly update. AAA’s report for Oct. 6 gives a national figure plus a state-by-state list, and EIA breaks out regions. Comparing the local station’s price with the state average shows whether a particular neighborhood is running high.
A monthly fuel budget set in the spring probably needs a second look. At September’s $4.33 average, a driver who buys 40 gallons a month paid about $173, compared with about $125 at last October’s $3.13. The same math at today’s $4.37 gives about $175. Writing down each fill-up, with gallons and price, shows within a month or two where the real cost is landing.
AAA’s Oct. 1 report is plain on the larger picture: its record September average of $4.33 a gallon is 50 cents above the old September high of $3.83 set in 2023.
More Financial Reading
- How many CDs can you park at 1 bank? FDIC rules you must know
- Adding someone to your bank account: tax traps and smart moves
- Bank statements: how long to keep them and when to toss them
This story was produced with AI assistance and edited for accuracy against the AAA and EIA pages linked above.


