
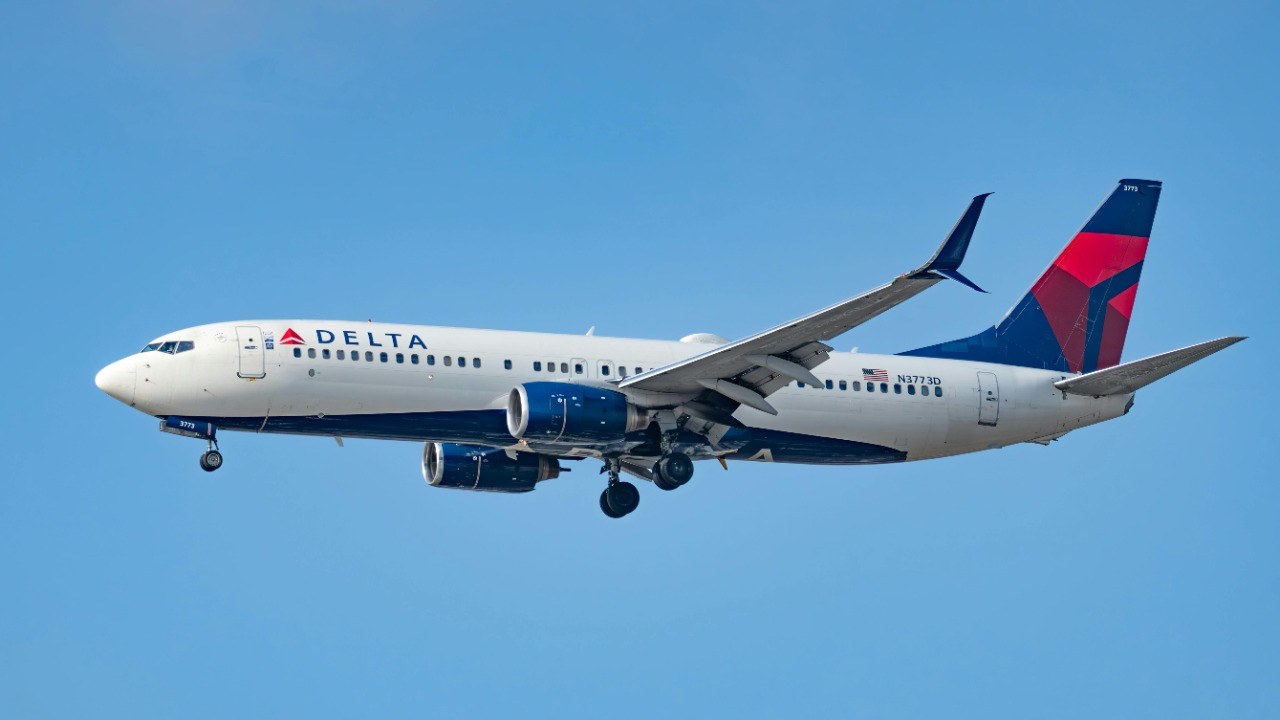
The average domestic airline ticket cost $436 in the second quarter of 2026, according to the Bureau of Transportation Statistics. That is 9.0% higher than the same quarter of 2025, or about $36 more per ticket. For a couple flying to see family, or a retiree booking a trip around a doctor’s appointment, the fare is one of the few household costs that resets with every purchase.
The $436.36 average in BTS’s release
The federal statistics agency’s second-quarter release, issued Sept. 25, puts the average domestic fare at $436.36 for April through June 2026. Its headline finding is that the figure barely moved from the first quarter, edging down 0.02%, from $436.45. The story is therefore in the comparison with a year earlier: the release says the second-quarter 2026 fare is up 9.0% from the second quarter of 2025.
Working backward from the published percentage shows the size of the change. Dividing $436.36 by 1.090 gives about $400, so the average ticket a year earlier cost roughly $400 in the same dollars. The difference is about $36 a ticket. A couple buying two tickets would see that difference double, and a round trip that uses a fare for each direction would add to it again.
What “inflation-adjusted” means for this number
The fares BTS publishes are inflation-adjusted, and the agency’s average fares tool explains that current-year constant dollars are used for the adjustment. In practice, that means the $436.36 is expressed in 2026 dollars and the earlier quarters it is compared with have been restated to match. The 9.0% rise is thus a rise in real terms, above and beyond general price growth, and not a figure inflated by the passage of time.
The same page describes what the fare includes: the price charged by the airline plus taxes and fees levied by an outside entity at the time of purchase. Optional service fees are not part of it. A traveler who pays extra to check a bag or pick a seat is therefore spending more than the average ticket figure alone suggests.
Round trips and one-ways
BTS splits the itineraries it counts into two kinds. Round trips made up 55% of the total and averaged $535 in the quarter, while one-way trips made up 45% and averaged $307. Because most of the tickets in the average are round trips, the single $436 figure blends two very different price points.
For a household, the round-trip number is the more useful one. Two travelers on average round-trip fares would spend $1,070, computed as $535 times two, before any bag fees or seat charges. For a couple planning a family visit or a holiday trip months ahead, that is the ticket cost alone, and it lands in one payment rather than spread over the month.
Distance from the 2025 low
The release also measures the fare against the most recent low. The lowest recent quarter was the third quarter of 2025, at $381, and BTS puts the second-quarter 2026 fare 14.3% above it. The agency does not attribute the rise to a single cause, and no cause is asserted here.
By airport size, the release lists the highest average fare, $458, at airports handling between 1.5 million and 1.99 million passengers, and the lowest, $353, at airports handling 50,000 to 99,999. Where a traveler starts a trip can therefore matter as much as the season.
A change in how fares are counted
One technical detail affects any comparison across the last year. BTS explains in its OD-40 program page that the sample of airline tickets it collects grew from 10 percent to 40 percent, with compliance required for air travel on or after July 1, 2025. The second quarter of 2025 came before that date and the second quarter of 2026 came after it. The release reports the 9.0% year-over-year figure as published, and this article does the same while noting that the two quarters rest on different sample sizes, which a careful reader may want to keep in mind.
The release adds one more figure about the airline side of the business: passenger fares made up 72.5% of the industry’s $101.5 billion in operating revenue in the first half of 2026, compared with 88.5% in 1990. Fares’ share of that revenue is lower than it was in 1990, so airlines now earn more of their income from sources other than the ticket itself.
What the second-quarter figures leave open
The BTS numbers cover completed tickets for one quarter and say nothing about what a ticket costs on a particular route or date. BTS lists its next release for around Jan. 8, 2027, which will show whether the fare holds near this level or moves again. Until then, the $436.36 average, the 9.0% annual rise and the $535 round-trip average are the agency’s own measure of what domestic air travel cost in the spring and early summer of 2026.
Keeping home costs in view when travel is expensive
The kit is meant for older homeowners and renters who are managing a fixed budget and want to know which programs can lower the cost of staying in their home. Property-tax bills, heating and cooling costs and repairs are the expenses that relief programs most often address, and each program has its own filing schedule.
The Senior Property Tax & Home-Cost Relief Kit explains the 5 kinds of property-tax relief and the circuit-breaker credit that includes renters, and it covers heating, cooling and home-repair help in an 11-page kit with an application log and renewal calendar.
Get the application log and renewal calendar in The Senior Property Tax & Home-Cost Relief Kit →
This piece was produced with the help of AI and reviewed against the BTS pages linked in the text.


