
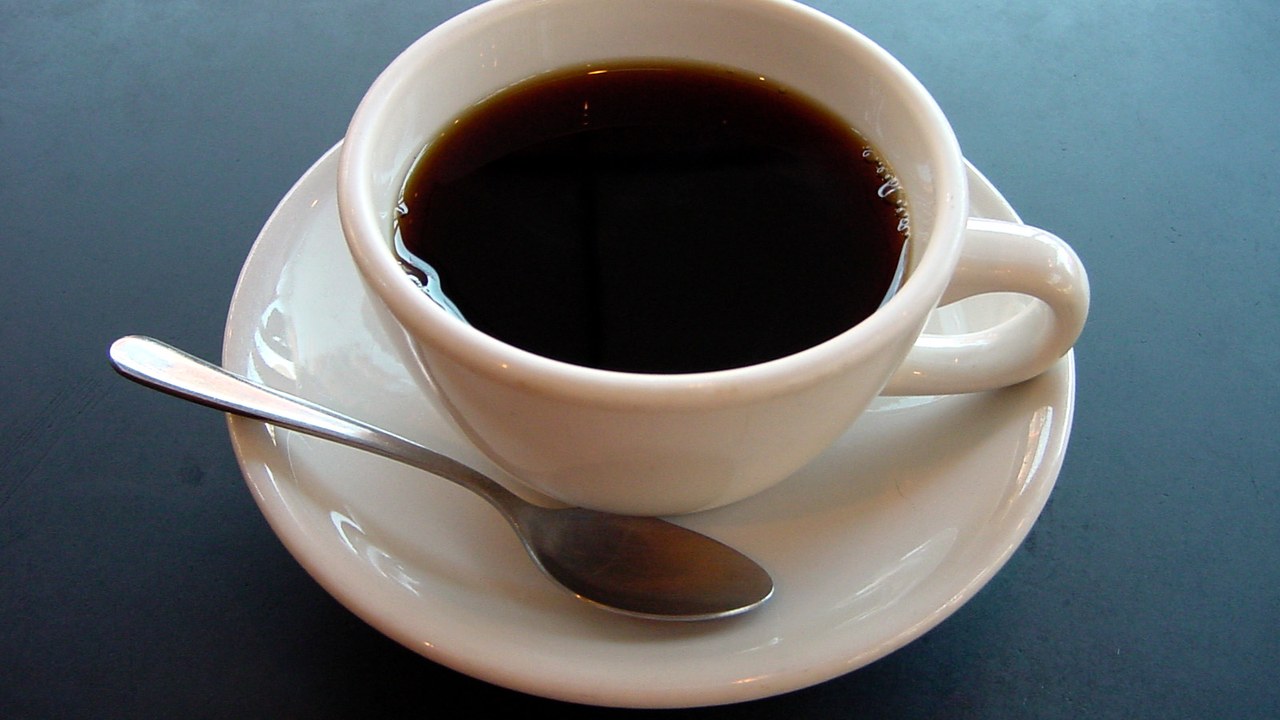
Coffee drinkers and soda buyers alike are facing a steeper grocery bill in 2026. The Sept. 25 Food Price Outlook from USDA’s Economic Research Service puts nonalcoholic beverages, the category that covers coffee, tea, soda and juice, on track for a 4.2% rise this year. The agency singles out coffee specifically as the fastest-moving item within that broader category, meaning the average understates how much a coffee-heavy shopping list could actually climb.
USDA’s coffee and beverage forecast: It says nothing about the heating bill or home-repair cost squeezed by the same household budget, a gap The Senior Property Tax & Home-Cost Relief Kit addresses. Match the 4.2% beverage forecast with heating and cooling help →
Why Coffee Is Driving the Category Higher
USDA’s Food Price Outlook groups coffee, tea, soda, juice and other non-alcoholic drinks into a single nonalcoholic beverages category, and the agency notes that retail coffee prices are increasing faster than prices for the other drinks in that group. Coffee is grown almost entirely outside the United States, mostly in Latin America, Africa and parts of Asia, and traded on global commodity markets, so its retail price responds to international crop conditions, shipping costs and currency swings in ways that a domestically bottled soda or juice typically does not. When coffee moves up faster than the rest of the category, it pulls the whole nonalcoholic beverages average higher along with it, and a household that drinks coffee daily is likely to feel more of the 2026 increase than one that mostly buys soda or juice.
USDA’s Forecast Range: 3.5% to 5.0%
The 4.2% figure is USDA’s midpoint estimate, not a guarantee. The agency’s actual forecast range runs from 3.5% to 5.0% for 2026, a gap of a percentage point and a half that reflects how much coffee’s international price swings could still shift the final number. A household near the low end of that range would see roughly 17% less of a price increase than a household experiencing the high end, even though both would be accurately described as facing “USDA’s 2026 beverage forecast.” That spread is also wider than the range USDA gives for some other categories, underscoring how much of the beverage forecast’s uncertainty traces back to coffee’s exposure to conditions well outside the United States.
Coffee’s Place Beside the 2.4% Grocery Forecast
At 4.2%, nonalcoholic beverages are forecast to rise nearly twice as fast as the 2.4% USDA projects for food at home overall in 2026. That comparison lines up with what the Bureau of Labor Statistics has already recorded for groceries broadly: a 2.2% year-over-year increase in food-at-home prices as of the August 2026 CPI, below the pace USDA now expects for beverages specifically. A household that drinks coffee daily and buys soda regularly could see its beverage spending rise noticeably faster than its overall grocery total suggests, since the beverage aisle is running well ahead of categories like produce or dairy.
The Math on a Daily Pot of Coffee
A household spending $15 a week on coffee, tea, soda and juice combined would see that total climb by roughly 63 cents a week at the 4.2% rate, or about $33 over a year. A heavier beverage buyer spending $30 a week would see closer to $1.26 a week, or about $66 a year. For someone who buys a $10 bag of ground coffee every two weeks, the same 4.2% rate adds roughly 42 cents to that bag, or about $11 a year if buying habits stay the same. None of those figures sounds large on its own, but each one compounds with every other grocery category also moving in 2026, some faster and some slower than the beverage aisle.
Tea, Soda and Juice Ride Along
USDA’s nonalcoholic beverages category is broader than just coffee. It also includes tea, carbonated soft drinks, non-carbonated fruit drinks and other bottled and packaged drinks sold at grocery stores, which is why the government tracks it as one combined line rather than breaking out coffee on its own in every report. That structure means a household that drinks mostly tea or soda, and skips coffee entirely, may see less of the 4.2% increase than the category average implies, since coffee is the item USDA specifically flags as moving fastest within the group. A family spending $50 a week across all of those drink types combined would see roughly $2.10 more a week at the 4.2% rate, or about $109 over the year, spread across whatever mix of coffee, soda, tea and juice actually fills that household’s cart.
Where the Beverage Forecast Could Go Next
The 4.2% figure will be revisited in each monthly Food Price Outlook update for the rest of 2026, and coffee’s global supply chain means the beverage forecast can move faster than most other grocery categories between updates. A shift in weather affecting major coffee-growing regions, a change in ocean shipping costs, or a swing in the dollar’s value against currencies used by coffee-exporting countries could all push the final 2026 number toward either end of USDA’s stated range before the year is out.
A Beverage Aisle Increase, and a Home Budget That Absorbs More Than That
A rising coffee and beverage bill lands on the same household budget that also has to cover a property-tax bill and the cost of keeping a home heated or cooled, expenses that don’t move on USDA’s schedule and don’t show up in any grocery forecast.
The Senior Property Tax & Home-Cost Relief Kit lays out heating, cooling and home-repair help alongside the 5 kinds of property-tax relief, so those costs get the same attention as a rising grocery bill.
Compare the home-repair help options in The Senior Property Tax & Home-Cost Relief Kit.
This article was produced with AI assistance and reviewed by a human editor, who confirmed the forecast figures against USDA’s own report.


