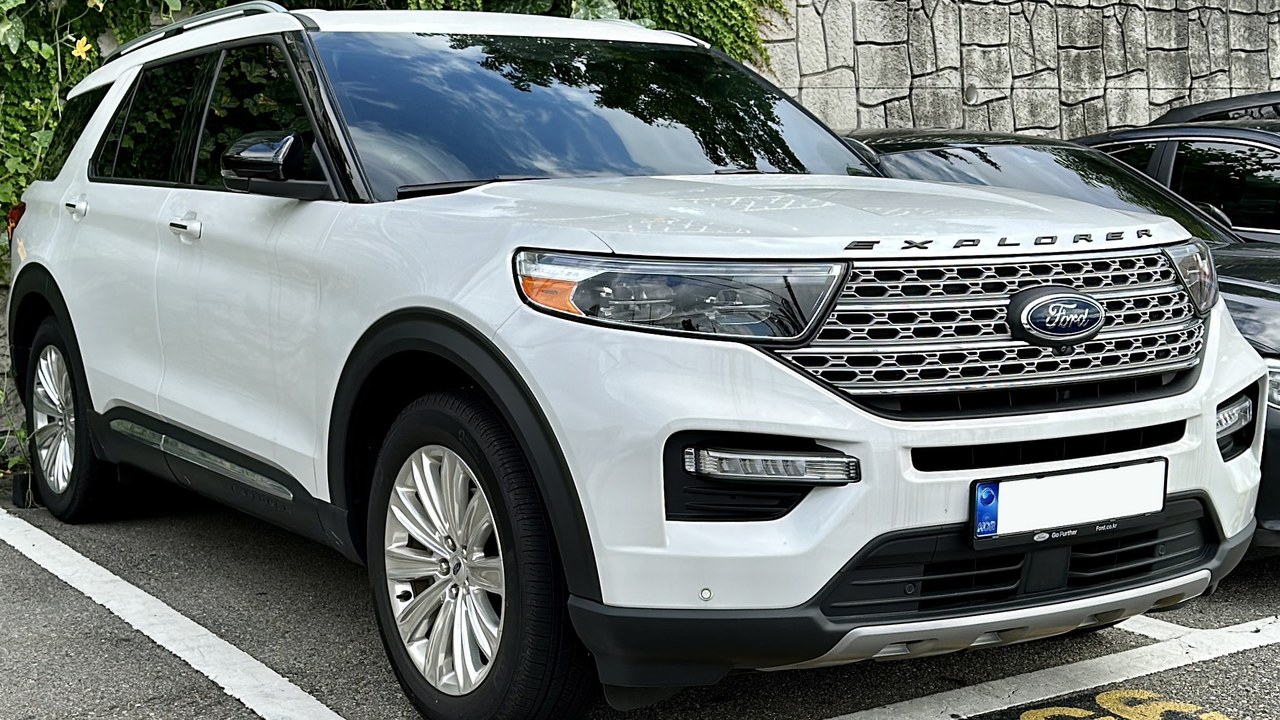
New vehicles are one of the quietest categories in an otherwise noisy inflation report. The U.S. Bureau of Labor Statistics’ Consumer Price Index shows new-vehicle prices up just 0.6 percent over the twelve months ending in August 2026, a fraction of the 3.4 percent increase in prices overall. That figure sits in the same report that shows energy costs up more than 16 percent, which makes the new-vehicle line one of the calmest numbers the Bureau published this month.
A category moving far slower than the rest of the report
The Bureau’s August 2026 news release, published September 11, lists new vehicles up 0.6 percent for the twelve months ending in August, and up 0.3 percent for the month itself on a seasonally adjusted basis. By comparison, the all-items index rose 3.4 percent over the same twelve months, and the energy index rose 16.3 percent. New vehicles are one of the few major categories in the report tracking below the overall inflation rate rather than above it.
The Bureau calculates the new-vehicle index from a national sample of actual transaction prices, then strips out the cost of any change in what a vehicle actually includes. Its quality-adjustment methodology page explains that new-vehicle prices are adjusted using cost data supplied directly by manufacturers — covering categories such as reliability, safety, fuel economy and comfort — rather than a statistical estimate of what a shopper might pay extra for those features. If a redesigned model costs more partly because of an added safety system, the Bureau removes the manufacturer-reported cost of that system before counting whatever price change is left. That is one reason the new-vehicle figure can move differently than the sticker prices shoppers see on a lot.
What a quiet category doesn’t fix: A slow-moving line in the new-vehicle index does nothing about the property taxes and utility bills that keep rising for the same household, and neither one carries an automatic discount. The Senior Property Tax & Home-Cost Relief Kit lays out the five kinds of relief that do exist, and what each one requires.
How the index compares with what shoppers are actually paying
Kelley Blue Book and Cox Automotive track a different number: the average amount buyers actually paid at the dealership, without adjusting for changes in features. Their August 2026 report put the average new-vehicle transaction price at $50,089, up 1.9 percent from August 2025 and 0.5 percent from July — the first month in 2026 the industry average crossed $50,000. Cox Automotive tied part of that increase to stronger sales of midsize SUVs and to price increases even in the subcompact SUV and compact car segments usually considered the more affordable end of the market.
The two figures are measuring different things, and both are correct. The Bureau’s 0.6 percent describes how much more it costs to buy an equivalent vehicle year over year, once feature changes are accounted for. Cox Automotive’s 1.9 percent, applied to a nearly $50,000 average, describes what buyers actually handed over, feature changes and all — including the effect of buyers choosing pricier trims and larger vehicles.
Cox Automotive’s report attributed part of August’s transaction-price increase to a shift in what people bought rather than to across-the-board price hikes: stronger sales of midsize SUVs pulled the industry average higher, and even the subcompact SUV and compact car segments, usually the more affordable end of the new-vehicle market, saw their own price increases. That mix effect — more buyers choosing larger or better-equipped vehicles — is part of what widens the gap between the government’s quality-adjusted 0.6 percent and the industry’s unadjusted 1.9 percent.
Where new vehicles stand next to used ones in the same report
The Bureau’s report shows used cars and trucks moving in the opposite direction: down 2.3 percent over the twelve months ending in August, even as the category rose 0.4 percent during the month itself. That leaves a wide gap between new and used vehicle prices in the same Consumer Price Index release, with new vehicles essentially flat for the year and used vehicles cheaper than they were twelve months earlier.
That divergence matters for a household weighing a new purchase against a used one, since the Bureau’s index reflects national averages rather than any single make, model or region. Local supply of a specific vehicle can move independently of both national trends.
A flat vehicle-cost index next to bills that keep climbing
New-vehicle prices barely moving in the government’s index does not mean a household’s other fixed costs are standing still. Property taxes and utility bills continue rising on their own schedules, and the paperwork behind any relief for either one is easy to let slide while other numbers get the attention.
The Senior Property Tax & Home-Cost Relief Kit covers the circuit-breaker credit that includes renters and help with heating, cooling and home repairs, along with an application log for keeping track of open filing windows.
Open the five kinds of relief in The Senior Property Tax & Home-Cost Relief Kit.
This article was produced with AI assistance and reviewed by a human editor. Figures are linked to their primary sources.