
The government’s latest reading on consumer prices tells a split kitchen-table story for August 2026: the grocery aisle held still while the cost of eating out kept climbing. The Bureau of Labor Statistics reported that its food-at-home index did not move at all last month, even as the price of restaurant and takeout meals rose 3.4 percent over the past year. For a household weighing a grocery run against a delivery order, that gap changes which choice actually protects the budget.
Food-at-Home Index Holds at Zero in August 2026
The food-at-home index — the part of the Consumer Price Index that tracks what shoppers pay at the grocery store — was flat in August 2026 on a seasonally adjusted basis. That followed a 0.1 percent dip in July, meaning the average grocery basket has now gone two straight months without a real seasonally adjusted increase even as broader inflation picked up elsewhere. Looking back across the year, the index has been anything but steady: it climbed 0.4 percent in February, fell 0.2 percent in March, jumped 0.7 percent in April, then eased to gains of 0.1 percent in May and 0.2 percent in June before slipping 0.1 percent in July and settling at zero in August, a clear deceleration since spring rather than a single one-month fluke.
The Bureau of Labor Statistics published the figures on September 11, 2026, in its Consumer Price Index Summary for August 2026, reporting that food at home is up 2.2 percent over the 12 months ending in August, not seasonally adjusted — a slower pace than the 2.7 percent rise for food overall and well behind the 3.4 percent increase posted for the all-items index over the same 12 months.
Free download: Property-tax freezes, exemptions and circuit-breaker credits, plus LIHEAP and shutoff protections, and what to gather before applying. Get the free property tax and utility relief finder.
Free download from RetireShield. Getting it also signs you up for the free Retirement Money Brief, a weekday email. Unsubscribe anytime.
Food-Away-From-Home Costs Climb 3.4 Percent Over the Year
Food away from home — restaurant meals, delivery orders and cafeteria purchases — rose 3.4 percent over the 12 months ending in August 2026, more than half again as fast as the 2.2 percent rise for groceries over the same stretch, according to the Bureau’s detailed CPI tables. Full-service restaurant meals rose 3.5 percent over the year, while limited-service meals, the fast-food and counter-service category, rose 3.2 percent — meaning even the cheaper, quick-service side of eating out is outrunning the grocery aisle.
On a monthly basis, the food-away-from-home index rose 0.3 percent in August, matching the same 0.3 percent pace it posted in July and June and roughly the rate it has held most of the summer, while the food-at-home index sat at zero. That steadiness is itself notable: restaurant and takeout prices have posted a monthly increase in each of the last seven months on record, without a single flat or negative reading, while grocery prices over that same span have swung between small gains, small losses and, now, no change at all. The divergence means the price advantage of cooking at home over ordering out widened again last month rather than narrowing.
Eggs, Dairy and Lettuce Move in Different Directions
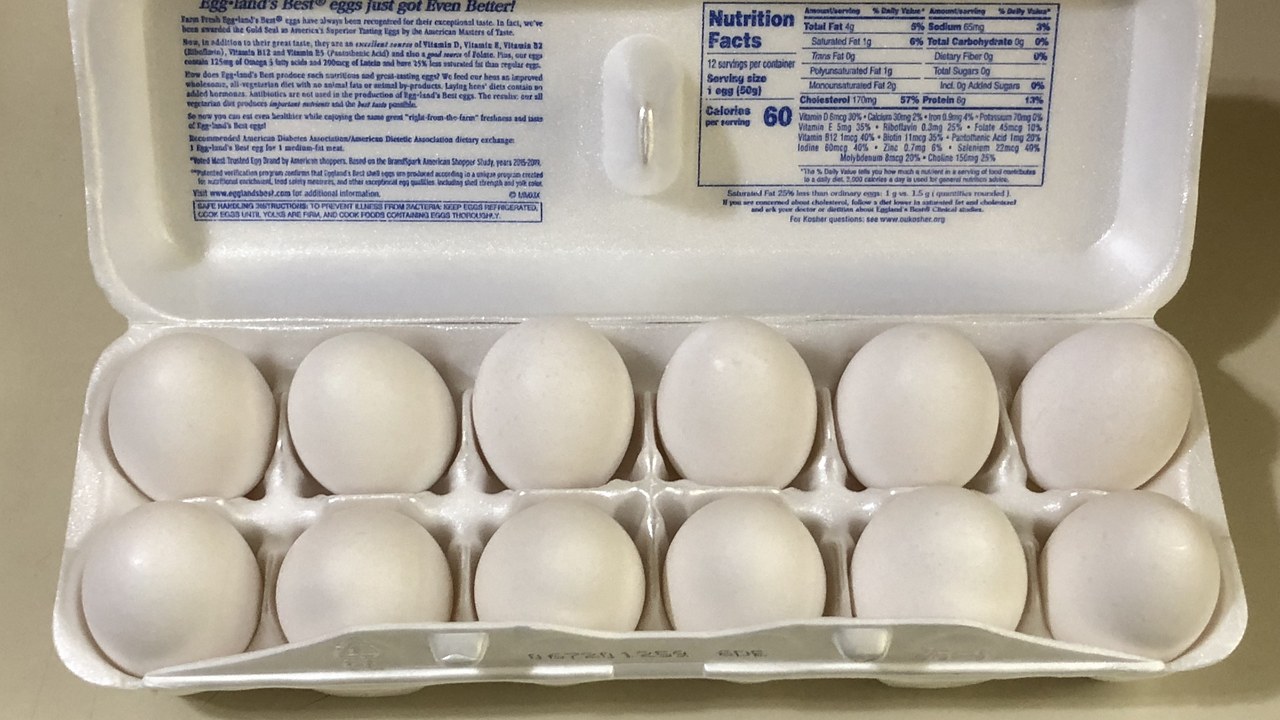
The flat food-at-home headline masks real movement underneath it. Four of the six major grocery-store food groups increased in August, led by meats, poultry, fish and eggs, up 0.1 percent for the month as the egg index alone jumped 2.9 percent, according to the Bureau’s detailed food and beverage category data. The nonalcoholic beverages index rose 0.2 percent in August and is up 3.7 percent over the year, and the cereals and bakery products index was unchanged in August but still up 2.6 percent over the 12 months. Dairy and related products rose 0.3 percent in August yet remain the only major grocery group cheaper than a year ago, down 0.3 percent over the 12 months ending in August.
Fruits and vegetables pulled the other direction, falling 0.4 percent in August after declines in the two prior months; lettuce alone dropped 6.2 percent in August on top of a 16.4 percent plunge in July. Even so, fruits and vegetables are still up 3.2 percent over the full year, and the broader “other food at home” category — which covers items such as sugar, fats, oils and snack foods — rose 0.1 percent in August and 2.4 percent over the year. Meats, poultry, fish and eggs as a group are up 1.1 percent over the 12 months, a fraction of the pace at restaurants, a reminder that one flat monthly total can hide aisle-by-aisle swings running in opposite directions at the same time.
The Two-Speed Grocery-Versus-Restaurant Gap Going Into Fall
For a household deciding between a grocery run and a takeout order, the August data gives a concrete number to weigh: cooking at home has opened roughly a 1.2-percentage-point advantage over eating out in the past year, based on the 2.2 percent food-at-home increase set against the 3.4 percent food-away-from-home increase reported in the same release. That gap has held or widened for several straight months even as the two categories occasionally traded places month to month, and it sits inside a broader picture where the all-items index rose 3.4 percent over the year and the core index, which excludes food and energy, rose 2.4 percent, according to the same summary. Food, in other words, is moving slower than headline inflation on the grocery side and faster than headline inflation on the restaurant side, in the same month, in the same report.
The Bureau of Labor Statistics has already set its next reporting date: the Consumer Price Index release covering September 2026 data is scheduled for October 14, 2026, according to the agency’s own economic release schedule. Until that report publishes, the August 2026 figures — food at home flat, food away from home up 3.4 percent for the year — stand as the most current, government-verified account of where grocery and restaurant prices sit.
Where Property Tax and Utility Costs Fit Into the Same Household Budget
The August data shows exactly which grocery categories moved and which held still, down to the egg carton and the lettuce bin, but few households keep that same kind of running record for property-tax exemptions, circuit-breaker credits or utility relief programs, which reset on their own separate calendars. A missed renewal window on a property-tax exemption, or an unclaimed circuit-breaker credit, can outweigh a whole flat month of grocery prices. Nothing in a CPI report tracks those dates for a household; that record has to come from somewhere else.
The Senior Property Tax & Home-Cost Relief Kit is an 11-page kit covering the 5 kinds of property-tax relief, the circuit-breaker credit that includes renters, and heating, cooling and home-repair help, along with an application log and renewal calendar.
See The Senior Property Tax & Home-Cost Relief Kit.
AI-assisted research and drafting; reviewed by an editor.


