
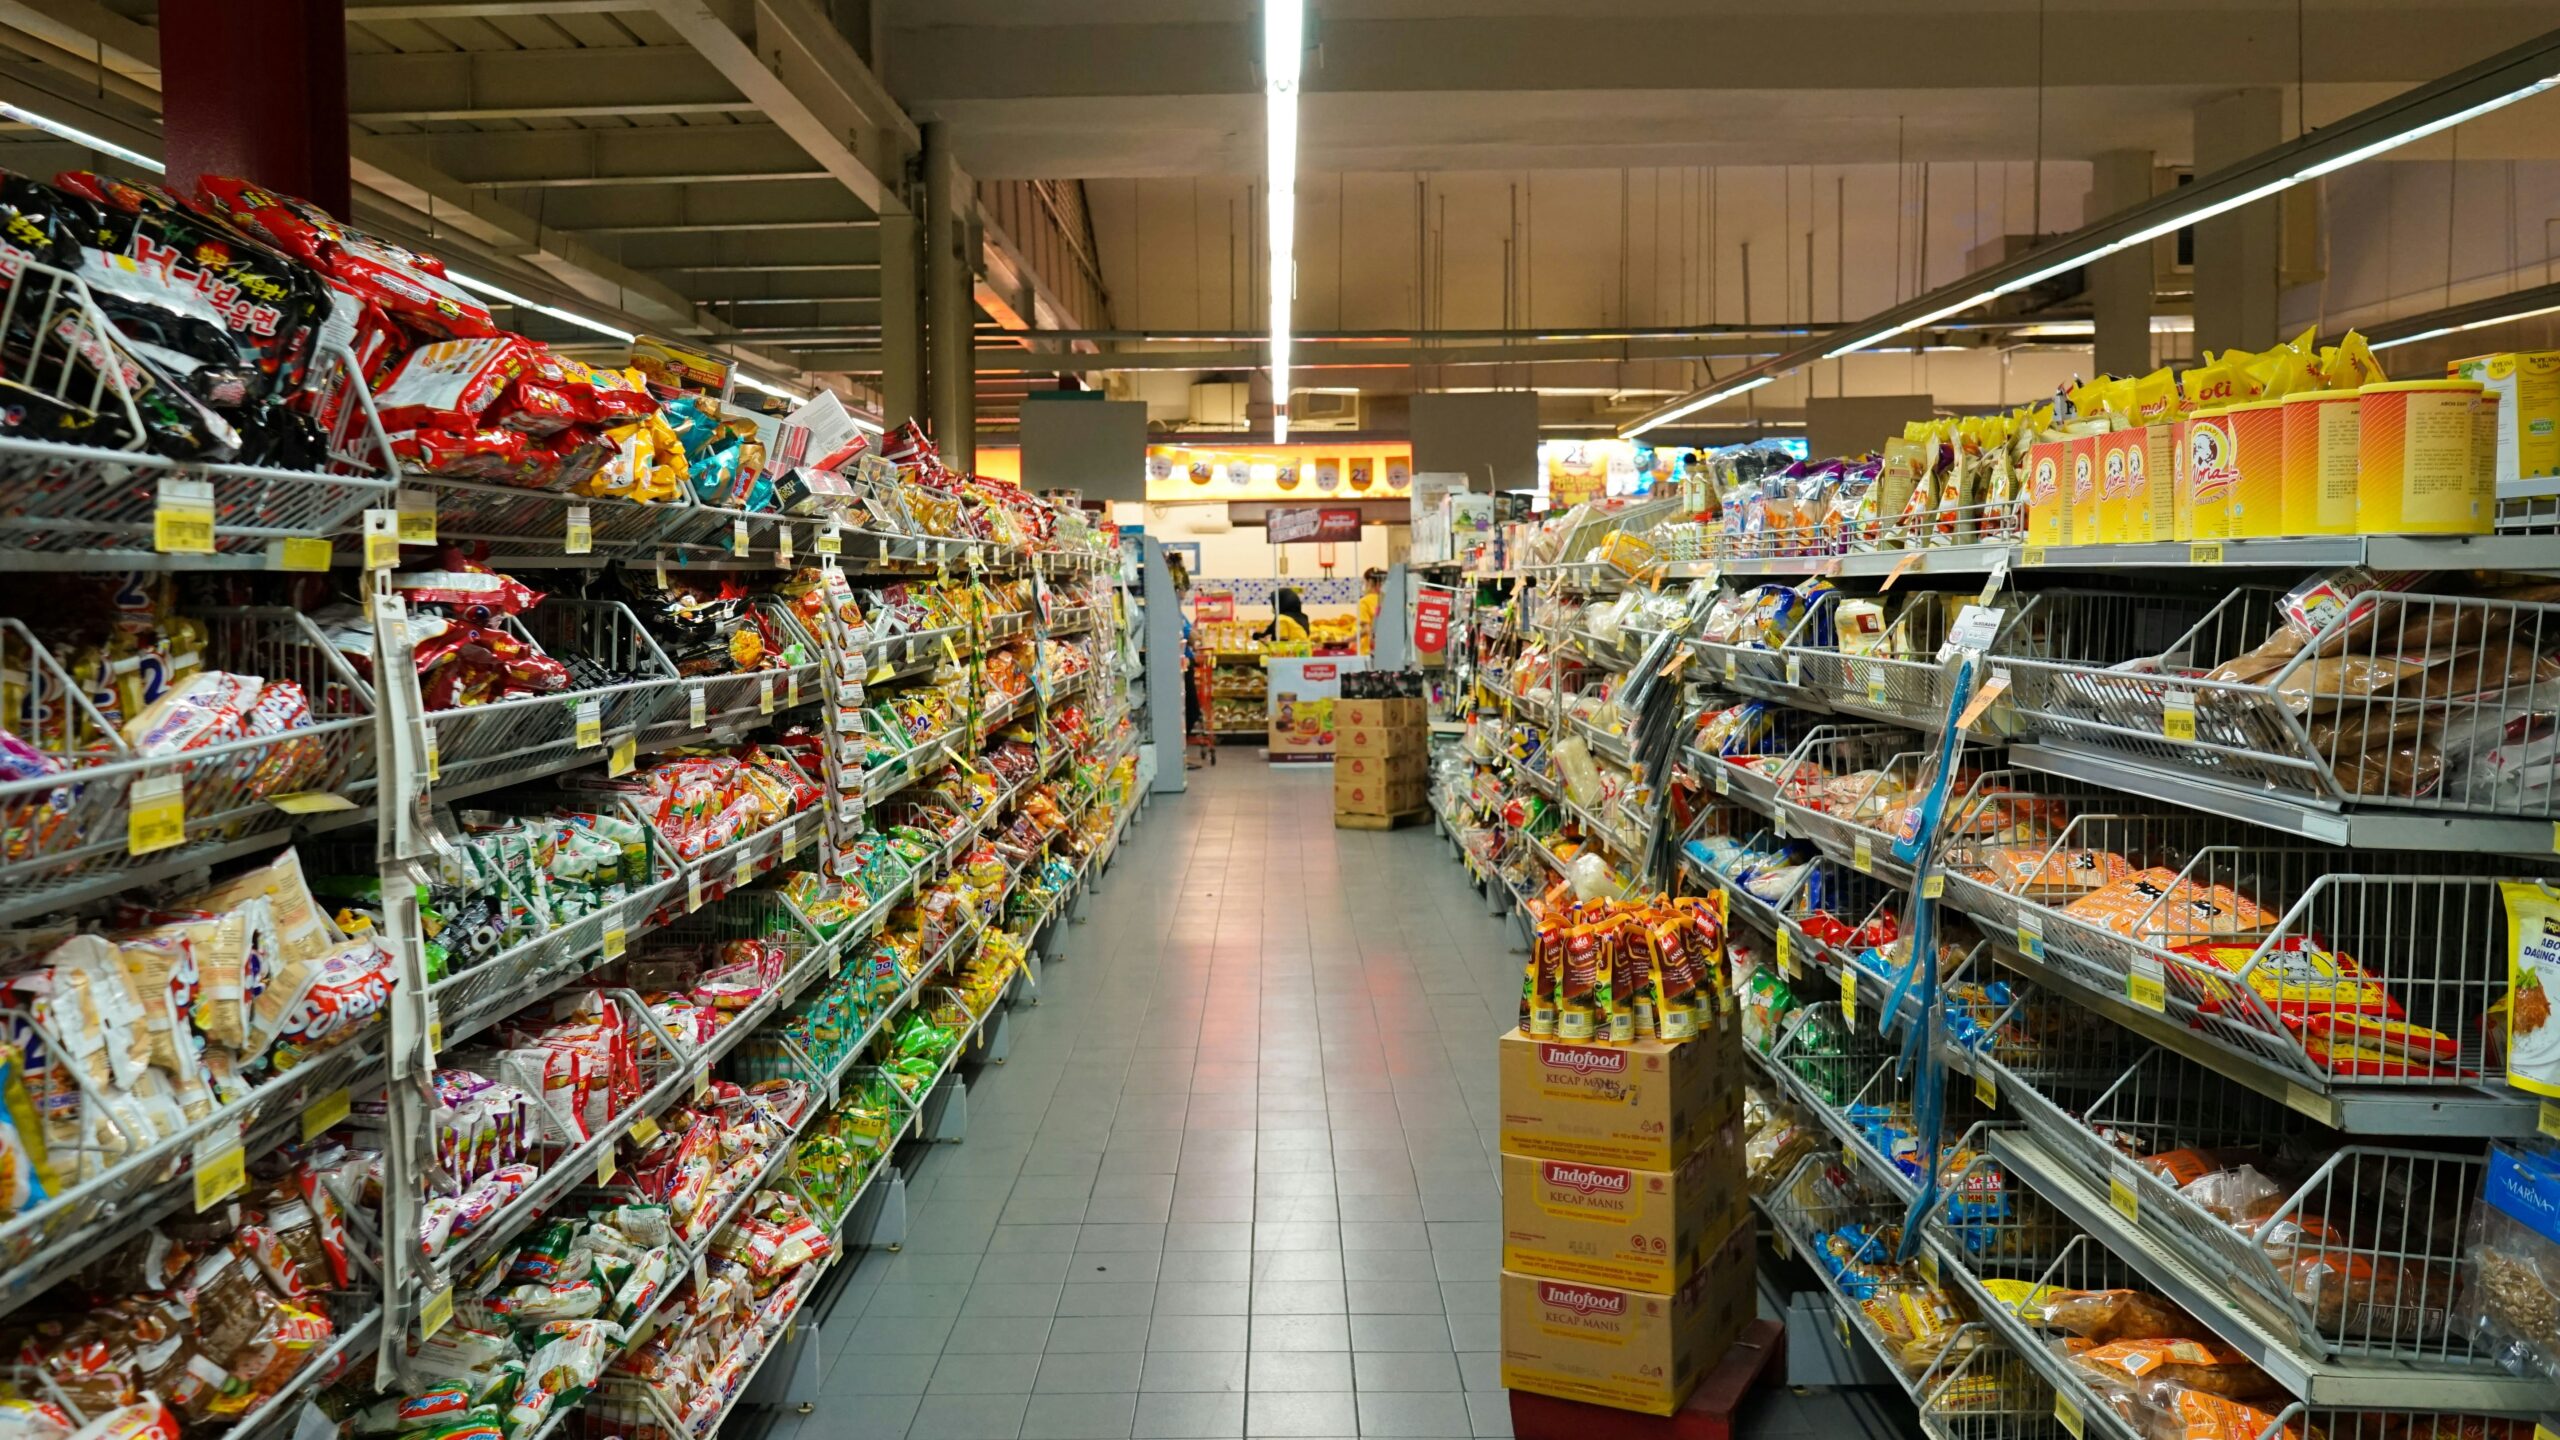
Grocery shoppers paid the most extra for coffee and soda this year, according to the Bureau of Labor Statistics’ latest Consumer Price Index, even as the overall grocery bill barely moved in August. Nonalcoholic beverages — the category that covers coffee, soda, and juice — rose 3.7 percent over the twelve months ending in August, the fastest increase of any major grocery group tracked in the report. Meanwhile, meat, eggs, and produce told a much calmer story, and eating out still cost noticeably more than cooking at home. For a household doing the weekly shop, the biggest relative jump is showing up in the parts of the cart that are easiest to buy less of, not the staples that are harder to skip.
Why One Grocery Category Can Outrun The Rest Of The Cart
A grocery bill is really dozens of separate markets bundled into one receipt — coffee beans, soda syrup, chicken, lettuce, and bread each have their own supply chains, growing seasons, and cost pressures, so it is normal for one aisle to move much faster than another in any given month. Coffee in particular is a global commodity crop grown almost entirely outside the United States, which exposes it to weather and currency swings that do not touch, say, a locally packaged carton of eggs. That is part of the backdrop for why coffee and soda can post the fastest increase in the grocery report while other aisles barely move.
Free retirement updates: Social Security and Medicare change every year, and nobody sends you a memo. Our free Retirement Shield newsletter breaks down what changed and what to do. Get it free in your inbox.
Coffee And Soda Outpace Every Other Grocery Aisle
The government’s detailed price index table shows the nonalcoholic beverages index climbing from 229.406 a year earlier to 237.834 in August, a 3.7 percent twelve-month increase and the fastest-rising of the six major grocery-store food groups the Bureau tracks. Cereals and bakery products were the next-closest mover, up 2.6 percent over the same period, with an index of 369.171 in August. Both categories rose faster than the 2.2 percent increase for the overall food-at-home index. The month-to-month path for beverages has been choppy, too: the same table shows the index falling 1.5 percent from May to June, then rising 0.9 percent in June and 0.2 percent in both July and August, seasonally adjusted — a bumpy ride rather than one steady climb. Coffee and soda are not actually moving together, even though the category headline lumps them into one number. The Bureau’s detailed table shows coffee itself falling 0.9 percent in August even as it remains up 6.1 percent for the year, while carbonated drinks rose 1.9 percent in August alone and are up 4.4 percent over twelve months. Coffee carries a relative importance of 0.224 percent of the entire consumer basket and carbonated drinks 0.325 percent — both are minor line items nationally, but they are pulling in opposite directions within the same month even as both post yearly increases.
Where Grocery Inflation Cooled — And Where It Didn’t
Other categories moved far more slowly. The index for meat, poultry, fish, and eggs rose just 1.1 percent over the twelve months ending in August, according to the Bureau’s Consumer Price Index Summary, even though eggs alone jumped 2.9 percent in August. Fruits and vegetables rose 3.2 percent over the year but have actually been getting cheaper lately — the index fell 0.4 percent in August, the third straight monthly decline, with lettuce alone dropping 6.2 percent after a 16.4 percent plunge in July. Dairy and related products were the only major grocery group to fall over the full year, down 0.3 percent. Eggs are the sharpest illustration of how a yearly figure and a monthly figure can tell opposite stories: the egg index is still down 23.0 percent from a year ago, before seasonal adjustment — the lingering scar of last year’s supply shock — even though the same index jumped 2.9 percent in August alone and had already risen 4.3 percent in June. A shopper comparing this August’s egg carton to last August’s still sees a much lower price; a shopper comparing this August to last month sees prices climbing again. Eating out tells a different story than eating in: food away from home rose 3.4 percent over the same twelve months — full service meals up 3.5 percent and limited service meals up 3.2 percent — compared with 2.2 percent for food at home. The overall food index, combining groceries and restaurants, rose 2.7 percent over the year.
What The Category Weights Say About A Real Grocery Bill
Government economists assign every item in the shopping cart a “relative importance” weight showing how much of the average household’s total spending, not just its food spending, that item represents. Food at home overall carries a weight of 8.232 percent of the entire consumer basket; nonalcoholic beverages, the fastest-rising piece of that, is a comparatively small 0.988 percent, with meats, poultry, fish, and eggs at 1.958 percent and fruits and vegetables at 1.282 percent. Those weights are why a 3.7 percent jump in a single beverage aisle does not move the overall inflation figure much, even though it can be very noticeable at the register: for a household spending $50 a month on coffee, soda, and juice, a straightforward application of that 3.7 percent yearly increase works out to about $1.85 more a month, or roughly $22 over a full year, just to keep buying the same items.
Groceries Are The Calmer Corner Of A Pricier Budget
For anyone budgeting on a fixed monthly income, the relevant comparison isn’t aisle to aisle — it’s groceries against everything else. The Bureau’s Consumer Price Index home page puts the all-items increase at 3.4 percent over the past year and 0.4 percent for August alone, ahead of both the 2.7 percent rise for food overall and the 2.2 percent increase for food at home. A grocery bill rising slower than the headline number is still rising, and it is doing so alongside other household costs that, in several categories, are climbing faster.
Watching For September’s Numbers
Every figure above reflects prices collected in August. The Bureau has already penciled in October 14 for the September release, which will show whether coffee and soda keep outpacing the rest of the grocery cart or whether the summer’s produce discounts carry into fall.
Relief that waits to be asked for
Property-tax freezes, exemptions and utility help are rarely applied automatically, and each has its own filing window.
The Senior Property Tax & Home-Cost Relief Kit includes an 11-page kit, the 5 kinds of property-tax relief and the circuit-breaker credit that includes renters.
See the five kinds of relief in The Senior Property Tax & Home-Cost Relief Kit.
This article was produced with AI assistance and reviewed by a human editor. Figures are linked to their primary sources; where a claim could not be verified from the public record, we say so.


